|
Download Data (XLS File) |
|
||||||||
|
||||||||
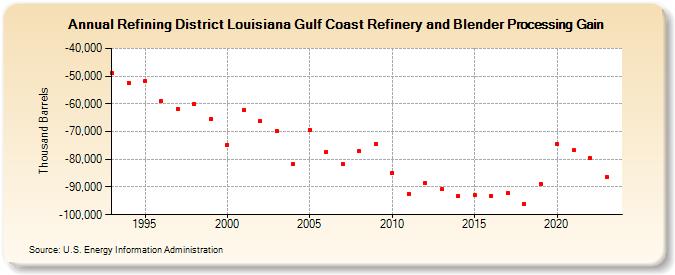
| Refining District Louisiana Gulf Coast Refinery and Blender Processing Gain (Thousand Barrels) | ||||||||
| Decade | Year-0 | Year-1 | Year-2 | Year-3 | Year-4 | Year-5 | Year-6 | Year-7 | Year-8 | Year-9 |
|---|---|---|---|---|---|---|---|---|---|---|
| 1990's | -48,801 | -52,370 | -51,725 | -58,991 | -61,800 | -59,918 | -65,483 | |||
| 2000's | -74,773 | -62,188 | -66,114 | -69,830 | -81,725 | -69,306 | -77,282 | -81,854 | -77,081 | -74,460 |
| 2010's | -84,774 | -92,431 | -88,383 | -90,883 | -93,309 | -92,982 | -93,142 | -92,123 | -96,067 | -88,822 |
| 2020's | -74,417 | -76,808 | -79,483 | -86,469 |
| - = No Data Reported; -- = Not Applicable; NA = Not Available; W = Withheld to avoid disclosure of individual company data. |
| Release Date: 3/29/2024 |
| Next Release Date: 8/30/2024 |