|
Download Data (XLS File) |
|
||||||||
|
||||||||
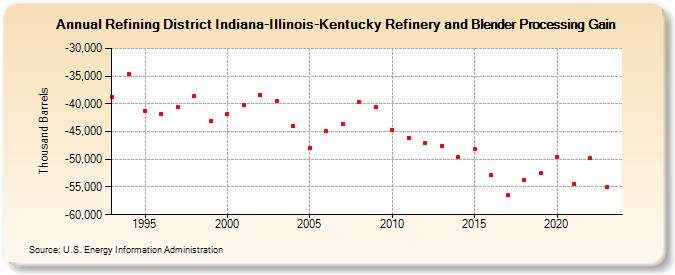
| Refining District Indiana-Illinois-Kentucky Refinery and Blender Processing Gain (Thousand Barrels) | ||||||||
| Decade | Year-0 | Year-1 | Year-2 | Year-3 | Year-4 | Year-5 | Year-6 | Year-7 | Year-8 | Year-9 |
|---|---|---|---|---|---|---|---|---|---|---|
| 1990's | -38,774 | -34,696 | -41,204 | -41,756 | -40,649 | -38,608 | -43,151 | |||
| 2000's | -41,755 | -40,165 | -38,321 | -39,455 | -43,934 | -47,906 | -44,959 | -43,550 | -39,715 | -40,658 |
| 2010's | -44,795 | -46,130 | -47,069 | -47,526 | -49,632 | -48,200 | -52,854 | -56,489 | -53,678 | -52,500 |
| 2020's | -49,544 | -54,502 | -49,792 | -54,930 |
| - = No Data Reported; -- = Not Applicable; NA = Not Available; W = Withheld to avoid disclosure of individual company data. |
| Release Date: 8/30/2024 |
| Next Release Date: 8/29/2025 |