|
Download Data (XLS File) |
|
||||||||
|
||||||||
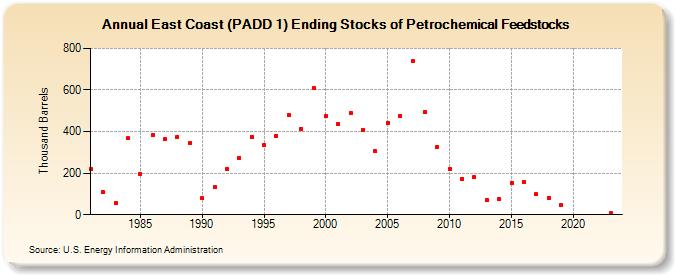
| East Coast (PADD 1) Ending Stocks of Petrochemical Feedstocks (Thousand Barrels) | ||||||||
| Decade | Year-0 | Year-1 | Year-2 | Year-3 | Year-4 | Year-5 | Year-6 | Year-7 | Year-8 | Year-9 |
|---|---|---|---|---|---|---|---|---|---|---|
| 1980's | 218 | 107 | 56 | 367 | 198 | 384 | 364 | 376 | 347 | |
| 1990's | 79 | 132 | 221 | 275 | 375 | 333 | 381 | 478 | 414 | 610 |
| 2000's | 473 | 437 | 491 | 408 | 305 | 443 | 477 | 737 | 495 | 327 |
| 2010's | 219 | 174 | 179 | 69 | 74 | 151 | 159 | 98 | 80 | 45 |
| 2020's | 7 |
| - = No Data Reported; -- = Not Applicable; NA = Not Available; W = Withheld to avoid disclosure of individual company data. |
| Release Date: 3/29/2024 |
| Next Release Date: 8/30/2024 |