|
Download Data (XLS File) |
|
||||||||
|
||||||||
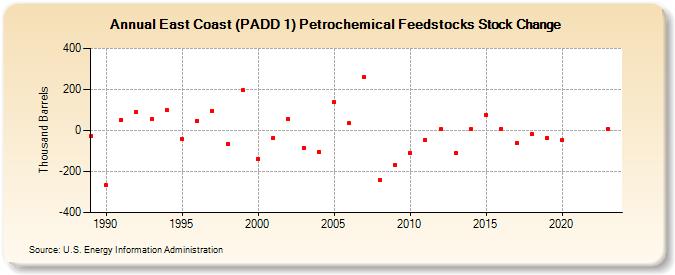
| East Coast (PADD 1) Petrochemical Feedstocks Stock Change (Thousand Barrels) | ||||||||
| Decade | Year-0 | Year-1 | Year-2 | Year-3 | Year-4 | Year-5 | Year-6 | Year-7 | Year-8 | Year-9 |
|---|---|---|---|---|---|---|---|---|---|---|
| 1980's | -29 | |||||||||
| 1990's | -268 | 53 | 89 | 54 | 100 | -42 | 48 | 97 | -64 | 196 |
| 2000's | -137 | -36 | 54 | -83 | -103 | 138 | 34 | 260 | -242 | -168 |
| 2010's | -108 | -45 | 5 | -110 | 5 | 77 | 8 | -61 | -18 | -35 |
| 2020's | -45 | 7 |
| - = No Data Reported; -- = Not Applicable; NA = Not Available; W = Withheld to avoid disclosure of individual company data. |
| Release Date: 3/29/2024 |
| Next Release Date: 8/30/2024 |