|
Download Data (XLS File) |
|
||||||||
|
||||||||
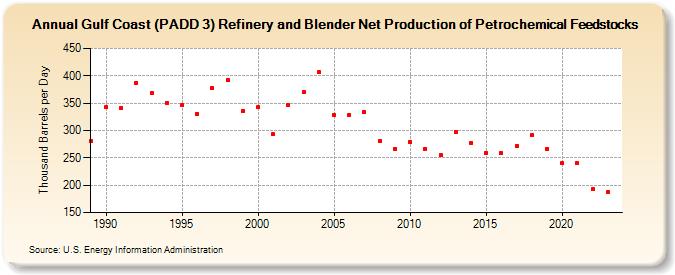
| Gulf Coast (PADD 3) Refinery and Blender Net Production of Petrochemical Feedstocks (Thousand Barrels per Day) | ||||||||
| Decade | Year-0 | Year-1 | Year-2 | Year-3 | Year-4 | Year-5 | Year-6 | Year-7 | Year-8 | Year-9 |
|---|---|---|---|---|---|---|---|---|---|---|
| 1980's | 280 | |||||||||
| 1990's | 342 | 341 | 387 | 368 | 351 | 347 | 331 | 378 | 392 | 336 |
| 2000's | 342 | 293 | 346 | 370 | 406 | 328 | 329 | 334 | 281 | 267 |
| 2010's | 279 | 266 | 255 | 298 | 278 | 259 | 258 | 272 | 292 | 267 |
| 2020's | 240 | 240 | 193 | 188 |
| - = No Data Reported; -- = Not Applicable; NA = Not Available; W = Withheld to avoid disclosure of individual company data. |
| Release Date: 3/29/2024 |
| Next Release Date: 8/30/2024 |