|
Download Data (XLS File) |
|
||||||||
|
||||||||
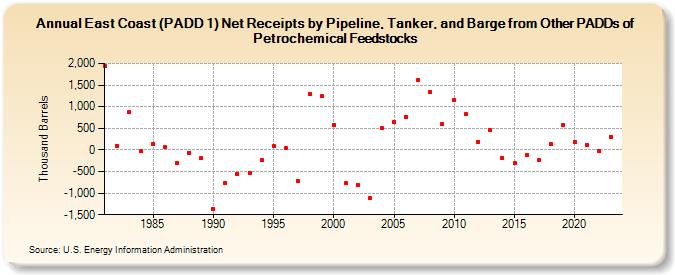
| East Coast (PADD 1) Net Receipts by Pipeline, Tanker, and Barge from Other PADDs of Petrochemical Feedstocks (Thousand Barrels) | ||||||||
| Decade | Year-0 | Year-1 | Year-2 | Year-3 | Year-4 | Year-5 | Year-6 | Year-7 | Year-8 | Year-9 |
|---|---|---|---|---|---|---|---|---|---|---|
| 1980's | 1,936 | 87 | 875 | -25 | 148 | 57 | -313 | -69 | -188 | |
| 1990's | -1,359 | -771 | -552 | -528 | -227 | 89 | 38 | -724 | 1,303 | 1,243 |
| 2000's | 579 | -772 | -804 | -1,120 | 497 | 650 | 769 | 1,619 | 1,351 | 598 |
| 2010's | 1,159 | 824 | 190 | 455 | -189 | -308 | -115 | -244 | 135 | 573 |
| 2020's | 192 | 111 | -31 | 300 |
| - = No Data Reported; -- = Not Applicable; NA = Not Available; W = Withheld to avoid disclosure of individual company data. |
| Release Date: 3/29/2024 |
| Next Release Date: 8/30/2024 |