|
Download Data (XLS File) |
|
||||||||
|
||||||||
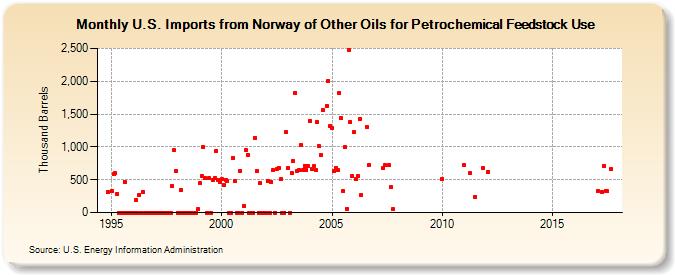
| U.S. Imports from Norway of Other Oils for Petrochemical Feedstock Use (Thousand Barrels) | ||||||||
| Year | Jan | Feb | Mar | Apr | May | Jun | Jul | Aug | Sep | Oct | Nov | Dec |
|---|---|---|---|---|---|---|---|---|---|---|---|---|
| 1994 | 309 | |||||||||||
| 1995 | 327 | 583 | 601 | 290 | 0 | 0 | 0 | 466 | 0 | 0 | 0 | 0 |
| 1996 | 0 | 186 | 0 | 274 | 0 | 320 | 0 | 0 | 0 | 0 | 0 | 0 |
| 1997 | 0 | 0 | 0 | 0 | 0 | 0 | 0 | 0 | 0 | 411 | 946 | 632 |
| 1998 | 0 | 0 | 350 | 0 | 0 | 0 | 0 | 0 | 0 | 0 | 0 | 50 |
| 1999 | 444 | 560 | 1,000 | 521 | 0 | 519 | 0 | 499 | 519 | 944 | 497 | 459 |
| 2000 | 507 | 422 | 503 | 483 | 0 | 0 | 838 | 481 | 0 | 0 | 633 | 0 |
| 2001 | 100 | 953 | 878 | 0 | 0 | 0 | 1,143 | 631 | 0 | 445 | 0 | 0 |
| 2002 | 0 | 477 | 0 | 464 | 643 | 0 | 661 | 686 | 511 | 0 | 0 | 1,226 |
| 2003 | 682 | 0 | 600 | 783 | 1,822 | 640 | 642 | 1,027 | 643 | 714 | 649 | 703 |
| 2004 | 1,396 | 659 | 702 | 644 | 1,377 | 1,007 | 877 | 1,560 | 1,630 | 2,007 | 1,319 | |
| 2005 | 1,287 | 633 | 679 | 644 | 1,823 | 1,434 | 325 | 993 | 60 | 2,475 | 1,380 | 554 |
| 2006 | 1,221 | 511 | 555 | 1,421 | 270 | 1,305 | 720 | |||||
| 2007 | 686 | 720 | 717 | 385 | 50 | |||||||
| 2010 | 508 | |||||||||||
| 2011 | 720 | 598 | 244 | 679 | ||||||||
| 2012 | 623 | |||||||||||
| 2017 | 325 | 320 | 709 | 329 | 323 | 657 | ||||||
| - = No Data Reported; -- = Not Applicable; NA = Not Available; W = Withheld to avoid disclosure of individual company data. |
| Release Date: 8/30/2024 |
| Next Release Date: 9/30/2024 |