|
Download Data (XLS File) |
|
||||||||
|
||||||||
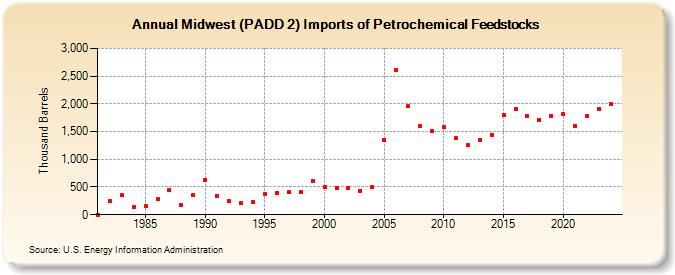
| Midwest (PADD 2) Imports of Petrochemical Feedstocks (Thousand Barrels) | ||||||||
| Decade | Year-0 | Year-1 | Year-2 | Year-3 | Year-4 | Year-5 | Year-6 | Year-7 | Year-8 | Year-9 |
|---|---|---|---|---|---|---|---|---|---|---|
| 1980's | 1 | 251 | 347 | 134 | 152 | 281 | 442 | 174 | 350 | |
| 1990's | 624 | 339 | 244 | 215 | 227 | 365 | 399 | 402 | 405 | 608 |
| 2000's | 505 | 489 | 489 | 428 | 494 | 1,349 | 2,614 | 1,958 | 1,594 | 1,506 |
| 2010's | 1,576 | 1,383 | 1,249 | 1,352 | 1,445 | 1,799 | 1,899 | 1,772 | 1,717 | 1,789 |
| 2020's | 1,816 | 1,608 | 1,773 | 1,909 |
| - = No Data Reported; -- = Not Applicable; NA = Not Available; W = Withheld to avoid disclosure of individual company data. |
| Release Date: 3/29/2024 |
| Next Release Date: 8/30/2024 |