|
Download Data (XLS File) |
|
||||||||
|
||||||||
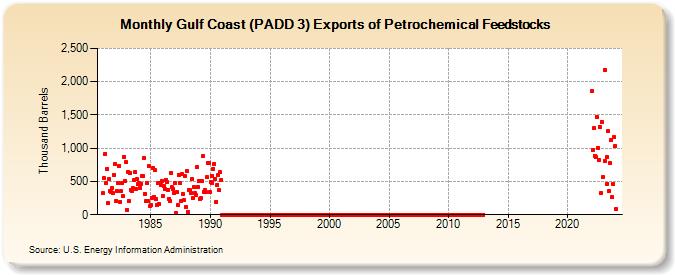
| Gulf Coast (PADD 3) Exports of Petrochemical Feedstocks (Thousand Barrels) | ||||||||
| Year | Jan | Feb | Mar | Apr | May | Jun | Jul | Aug | Sep | Oct | Nov | Dec |
|---|---|---|---|---|---|---|---|---|---|---|---|---|
| 1981 | 319 | 548 | 914 | 478 | 693 | 174 | 538 | 359 | 346 | 396 | 323 | 604 |
| 1982 | 769 | 208 | 352 | 472 | 734 | 197 | 349 | 484 | 278 | 875 | 509 | 787 |
| 1983 | 76 | 646 | 204 | 627 | 369 | 359 | 397 | 527 | 642 | 381 | 531 | 457 |
| 1984 | 481 | 399 | 467 | 577 | 577 | 854 | 316 | 203 | 480 | 203 | 729 | 124 |
| 1985 | 143 | 258 | 707 | 266 | 668 | 234 | 153 | 473 | 165 | 476 | 451 | 508 |
| 1986 | 287 | 437 | 381 | 527 | 486 | 370 | 241 | 200 | 633 | 410 | 392 | 328 |
| 1987 | 480 | 27 | 335 | 143 | 602 | 475 | 202 | 608 | 313 | 215 | 582 | 119 |
| 1988 | 664 | 41 | 373 | 371 | 323 | 530 | 257 | 413 | 331 | 299 | 710 | 417 |
| 1989 | 500 | 234 | 246 | 510 | 877 | 344 | 367 | 344 | 562 | 775 | 784 | 338 |
| 1990 | 494 | 579 | 484 | 692 | 766 | 542 | 195 | 453 | 599 | 371 | 638 | 522 |
| 1991 | 0 | 0 | 0 | 0 | 0 | 0 | 0 | 0 | 0 | 0 | 0 | 0 |
| 1992 | 0 | 0 | 0 | 0 | 0 | 0 | 0 | 0 | 0 | 0 | 0 | 0 |
| 1993 | 0 | 0 | 0 | 0 | 0 | 0 | 0 | 0 | 0 | 0 | 0 | 0 |
| 1994 | 0 | 0 | 0 | 0 | 0 | 0 | 0 | 0 | 0 | 0 | 0 | 0 |
| 1995 | 0 | 0 | 0 | 0 | 0 | 0 | 0 | 0 | 0 | 0 | 0 | 0 |
| 1996 | 0 | 0 | 0 | 0 | 0 | 0 | 0 | 0 | 0 | 0 | 0 | 0 |
| 1997 | 0 | 0 | 0 | 0 | 0 | 0 | 0 | 0 | 0 | 0 | 0 | 0 |
| 1998 | 0 | 0 | 0 | 0 | 0 | 0 | 0 | 0 | 0 | 0 | 0 | 0 |
| 1999 | 0 | 0 | 0 | 0 | 0 | 0 | 0 | 0 | 0 | 0 | 0 | 0 |
| 2000 | 0 | 0 | 0 | 0 | 0 | 0 | 0 | 0 | 0 | 0 | 0 | 0 |
| 2001 | 0 | 0 | 0 | 0 | 0 | 0 | 0 | 0 | 0 | 0 | 0 | 0 |
| 2002 | 0 | 0 | 0 | 0 | 0 | 0 | 0 | 0 | 0 | 0 | 0 | 0 |
| 2003 | 0 | 0 | 0 | 0 | 0 | 0 | 0 | 0 | 0 | 0 | 0 | 0 |
| 2004 | 0 | 0 | 0 | 0 | 0 | 0 | 0 | 0 | 0 | 0 | 0 | 0 |
| 2005 | 0 | 0 | 0 | 0 | 0 | 0 | 0 | 0 | 0 | 0 | 0 | 0 |
| 2006 | 0 | 0 | 0 | 0 | 0 | 0 | 0 | 0 | 0 | 0 | 0 | 0 |
| 2007 | 0 | 0 | 0 | 0 | 0 | 0 | 0 | 0 | 0 | 0 | 0 | 0 |
| 2008 | 0 | 0 | 0 | 0 | 0 | 0 | 0 | 0 | 0 | 0 | 0 | 0 |
| 2009 | 0 | 0 | 0 | 0 | 0 | 0 | 0 | 0 | 0 | 0 | 0 | 0 |
| 2010 | 0 | 0 | 0 | 0 | 0 | 0 | 0 | 0 | 0 | 0 | 0 | 0 |
| 2011 | 0 | 0 | 0 | 0 | 0 | 0 | 0 | 0 | 0 | 0 | 0 | 0 |
| 2012 | 0 | 0 | 0 | 0 | 0 | 0 | 0 | 0 | 0 | 0 | 0 | 0 |
| 2013 | 0 | 0 | 0 | 0 | 0 | 0 | 0 | 0 | 0 | 0 | 0 | 0 |
| 2014 | 0 | 0 | 0 | 0 | 0 | |||||||
| 2022 | 1,853 | 979 | 1,297 | 889 | 875 | 1,471 | 1,004 | 819 | 1,323 | 322 | 1,400 | 562 |
| 2023 | 810 | 2,174 | 862 | 467 | 1,254 | 356 | 772 | 1,123 | 259 | 464 | 1,167 | |
| 2024 | 1,034 | |||||||||||
| - = No Data Reported; -- = Not Applicable; NA = Not Available; W = Withheld to avoid disclosure of individual company data. |
| Release Date: 3/29/2024 |
| Next Release Date: 4/30/2024 |