|
Download Data (XLS File) |
|
||||||||
|
||||||||
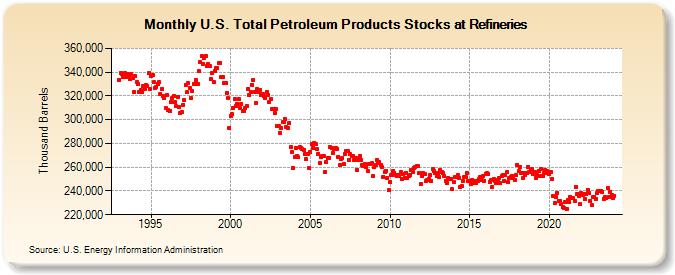
| U.S. Total Petroleum Products Stocks at Refineries (Thousand Barrels) | ||||||||
| Year | Jan | Feb | Mar | Apr | May | Jun | Jul | Aug | Sep | Oct | Nov | Dec |
|---|---|---|---|---|---|---|---|---|---|---|---|---|
| 1993 | 333,643 | 339,570 | 338,300 | 335,770 | 339,322 | 335,708 | 338,703 | 337,162 | 333,860 | 338,585 | 335,068 | 323,622 |
| 1994 | 336,666 | 331,528 | 329,794 | 323,374 | 325,339 | 323,032 | 328,061 | 326,071 | 329,000 | 328,321 | 338,960 | 326,131 |
| 1995 | 337,151 | 337,249 | 331,326 | 326,290 | 327,544 | 329,976 | 331,290 | 322,005 | 326,055 | 320,191 | 318,239 | 309,536 |
| 1996 | 320,633 | 308,337 | 307,712 | 314,663 | 318,225 | 320,087 | 314,778 | 311,128 | 319,197 | 310,281 | 305,685 | 306,111 |
| 1997 | 312,770 | 316,371 | 329,205 | 322,876 | 330,533 | 326,964 | 318,057 | 323,828 | 330,133 | 329,985 | 333,050 | 330,231 |
| 1998 | 341,015 | 348,188 | 353,630 | 347,264 | 352,008 | 353,198 | 344,767 | 346,734 | 345,175 | 333,845 | 339,584 | 331,470 |
| 1999 | 341,354 | 343,081 | 343,446 | 347,930 | 347,685 | 336,107 | 335,785 | 330,877 | 331,131 | 322,742 | 317,927 | 293,201 |
| 2000 | 303,166 | 304,752 | 309,630 | 317,165 | 311,129 | 313,057 | 317,100 | 309,830 | 313,208 | 307,216 | 307,702 | 309,841 |
| 2001 | 311,397 | 326,161 | 320,681 | 322,950 | 329,524 | 333,224 | 323,653 | 314,047 | 325,953 | 323,484 | 324,831 | 320,564 |
| 2002 | 321,274 | 319,726 | 318,160 | 323,480 | 320,987 | 315,236 | 317,197 | 308,704 | 309,249 | 305,675 | 308,929 | 294,705 |
| 2003 | 294,550 | 288,681 | 293,168 | 297,790 | 298,448 | 300,548 | 293,835 | 292,737 | 297,355 | 276,892 | 272,583 | 259,358 |
| 2004 | 268,744 | 276,270 | 269,550 | 268,290 | 276,587 | 276,390 | 275,194 | 274,698 | 271,417 | 266,497 | 271,390 | 259,006 |
| 2005 | 272,961 | 279,483 | 276,107 | 280,697 | 279,836 | 274,930 | 271,318 | 263,388 | 268,308 | 269,184 | 269,789 | 256,240 |
| 2006 | 264,712 | 267,621 | 268,126 | 276,740 | 275,954 | 272,339 | 275,521 | 276,548 | 275,723 | 268,737 | 262,009 | 267,232 |
| 2007 | 267,733 | 262,393 | 271,215 | 273,438 | 273,715 | 266,095 | 271,027 | 269,688 | 269,391 | 266,202 | 267,996 | 257,845 |
| 2008 | 265,969 | 269,522 | 265,635 | 261,667 | 260,988 | 262,813 | 259,970 | 257,108 | 262,907 | 263,011 | 263,291 | 252,184 |
| 2009 | 260,004 | 261,567 | 266,190 | 263,165 | 264,295 | 261,842 | 259,907 | 252,038 | 256,211 | 256,886 | 251,032 | 240,671 |
| 2010 | 247,456 | 253,164 | 256,417 | 255,312 | 253,489 | 252,221 | 253,102 | 252,596 | 255,603 | 249,693 | 254,361 | 250,925 |
| 2011 | 255,416 | 251,212 | 252,946 | 253,033 | 257,759 | 256,142 | 259,457 | 260,026 | 260,669 | 260,795 | 255,497 | 245,687 |
| 2012 | 252,610 | 254,983 | 254,441 | 248,280 | 248,960 | 250,451 | 253,153 | 248,634 | 258,863 | 256,988 | 254,707 | 252,430 |
| 2013 | 254,876 | 251,693 | 257,764 | 256,049 | 254,882 | 252,675 | 248,604 | 246,328 | 250,881 | 249,700 | 250,118 | 241,286 |
| 2014 | 247,894 | 251,814 | 251,399 | 253,569 | 251,164 | 243,185 | 244,076 | 248,041 | 251,938 | 251,647 | 255,158 | 247,998 |
| 2015 | 248,330 | 245,805 | 249,601 | 246,866 | 248,725 | 247,107 | 248,623 | 250,097 | 251,893 | 249,040 | 252,499 | 248,691 |
| 2016 | 254,619 | 254,802 | 254,236 | 247,930 | 248,924 | 243,157 | 249,951 | 248,136 | 247,083 | 249,401 | 250,680 | 246,303 |
| 2017 | 252,665 | 253,073 | 248,775 | 253,405 | 255,923 | 247,282 | 250,721 | 251,924 | 252,698 | 251,257 | 249,561 | 253,254 |
| 2018 | 261,906 | 256,451 | 260,225 | 255,304 | 250,536 | 254,884 | 253,777 | 255,156 | 260,434 | 255,709 | 257,487 | 258,582 |
| 2019 | 254,322 | 256,124 | 251,259 | 253,163 | 257,150 | 252,660 | 258,595 | 252,587 | 255,073 | 257,530 | 256,850 | 255,038 |
| 2020 | 253,999 | 255,601 | 249,924 | 235,900 | 229,926 | 235,121 | 238,368 | 231,838 | 231,581 | 228,983 | 226,461 | 225,254 |
| 2021 | 230,683 | 225,097 | 232,775 | 230,970 | 235,243 | 233,677 | 233,758 | 231,520 | 243,619 | 237,704 | 235,399 | 228,806 |
| 2022 | 237,958 | 237,000 | 237,525 | 233,177 | 237,164 | 240,978 | 238,435 | 231,673 | 228,160 | 234,606 | 235,214 | 233,107 |
| 2023 | 238,158 | 240,137 | 240,241 | 240,003 | 238,938 | 233,295 | 234,689 | 233,819 | 242,828 | 235,010 | 239,514 | 236,879 |
| 2024 | 233,741 | |||||||||||
| - = No Data Reported; -- = Not Applicable; NA = Not Available; W = Withheld to avoid disclosure of individual company data. |
| Release Date: 3/29/2024 |
| Next Release Date: 4/30/2024 |