|
Download Data (XLS File) |
|
||||||||
|
||||||||
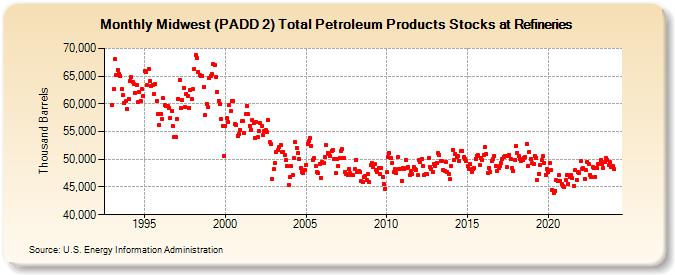
| Midwest (PADD 2) Total Petroleum Products Stocks at Refineries (Thousand Barrels) | ||||||||
| Year | Jan | Feb | Mar | Apr | May | Jun | Jul | Aug | Sep | Oct | Nov | Dec |
|---|---|---|---|---|---|---|---|---|---|---|---|---|
| 1993 | 59,857 | 62,671 | 68,047 | 65,157 | 66,140 | 65,455 | 65,021 | 62,589 | 61,560 | 60,144 | 60,462 | 58,984 |
| 1994 | 60,957 | 64,146 | 64,807 | 63,940 | 63,576 | 62,024 | 63,363 | 60,278 | 62,164 | 60,515 | 62,710 | 61,351 |
| 1995 | 66,008 | 65,695 | 63,392 | 66,245 | 64,204 | 63,202 | 63,465 | 61,840 | 63,509 | 60,573 | 58,144 | 56,171 |
| 1996 | 58,233 | 57,277 | 60,971 | 59,802 | 59,534 | 59,639 | 59,300 | 57,446 | 58,748 | 56,023 | 54,054 | 53,947 |
| 1997 | 57,184 | 60,944 | 64,312 | 59,279 | 60,750 | 62,944 | 59,408 | 61,832 | 61,425 | 59,330 | 62,454 | 60,800 |
| 1998 | 62,610 | 66,287 | 68,735 | 68,209 | 65,787 | 65,233 | 64,971 | 65,085 | 63,095 | 58,072 | 60,042 | 59,357 |
| 1999 | 64,645 | 65,006 | 65,339 | 67,200 | 66,960 | 64,831 | 62,210 | 60,588 | 59,952 | 57,203 | 56,047 | 50,584 |
| 2000 | 56,029 | 57,375 | 56,756 | 59,814 | 58,720 | 60,555 | 60,546 | 56,305 | 56,269 | 54,202 | 54,534 | 55,370 |
| 2001 | 56,857 | 56,943 | 54,794 | 58,211 | 59,649 | 58,083 | 56,079 | 55,333 | 57,013 | 56,555 | 53,810 | 56,746 |
| 2002 | 53,933 | 55,167 | 56,508 | 56,053 | 54,365 | 55,069 | 55,301 | 54,886 | 57,113 | 53,045 | 52,679 | 46,400 |
| 2003 | 48,167 | 49,342 | 51,247 | 51,601 | 52,290 | 52,655 | 51,281 | 51,385 | 50,781 | 49,908 | 48,720 | 45,382 |
| 2004 | 46,756 | 48,727 | 47,185 | 50,185 | 53,072 | 52,048 | 51,106 | 50,002 | 48,500 | 47,755 | 47,596 | 48,077 |
| 2005 | 49,002 | 52,786 | 53,255 | 53,793 | 52,414 | 49,890 | 50,250 | 48,801 | 47,674 | 47,456 | 49,229 | 46,683 |
| 2006 | 49,576 | 49,307 | 50,322 | 52,557 | 51,141 | 51,005 | 50,592 | 51,512 | 51,609 | 50,051 | 47,451 | 50,052 |
| 2007 | 48,773 | 50,240 | 51,553 | 51,801 | 50,319 | 47,759 | 47,426 | 47,236 | 48,278 | 47,469 | 47,162 | 47,231 |
| 2008 | 48,239 | 49,951 | 47,668 | 47,817 | 47,670 | 46,089 | 45,896 | 46,729 | 46,913 | 46,253 | 47,335 | 45,852 |
| 2009 | 48,883 | 49,342 | 48,629 | 49,135 | 48,148 | 47,714 | 48,405 | 47,294 | 48,400 | 46,834 | 45,464 | 44,719 |
| 2010 | 47,680 | 50,443 | 51,174 | 50,144 | 49,375 | 47,617 | 48,163 | 47,462 | 50,333 | 48,237 | 48,329 | 46,165 |
| 2011 | 48,396 | 48,267 | 49,876 | 48,479 | 48,666 | 47,116 | 47,926 | 47,360 | 48,688 | 48,269 | 48,142 | 47,120 |
| 2012 | 49,836 | 49,595 | 50,029 | 48,743 | 47,231 | 47,400 | 47,285 | 50,181 | 48,615 | 48,177 | 47,675 | 49,184 |
| 2013 | 48,698 | 49,337 | 51,066 | 50,759 | 49,767 | 49,710 | 48,120 | 47,844 | 49,515 | 47,689 | 47,409 | 46,435 |
| 2014 | 48,842 | 51,652 | 49,943 | 51,000 | 50,394 | 50,626 | 49,740 | 51,457 | 51,495 | 50,333 | 50,045 | 49,637 |
| 2015 | 48,736 | 48,283 | 49,155 | 47,735 | 48,332 | 48,449 | 50,030 | 50,632 | 50,699 | 48,959 | 50,264 | 49,840 |
| 2016 | 50,823 | 52,288 | 50,983 | 47,467 | 48,452 | 47,712 | 49,708 | 50,011 | 50,592 | 48,833 | 47,850 | 48,434 |
| 2017 | 48,715 | 49,349 | 50,022 | 50,409 | 50,664 | 48,550 | 50,540 | 50,825 | 50,047 | 48,470 | 47,863 | 49,947 |
| 2018 | 52,474 | 51,194 | 50,506 | 50,054 | 49,701 | 49,844 | 50,255 | 50,375 | 52,779 | 48,872 | 51,327 | 50,033 |
| 2019 | 49,263 | 49,161 | 50,549 | 50,276 | 46,251 | 47,313 | 48,989 | 49,796 | 50,587 | 49,375 | 47,203 | 48,324 |
| 2020 | 47,777 | 49,323 | 48,040 | 44,516 | 43,833 | 44,323 | 46,179 | 46,007 | 47,172 | 46,107 | 45,552 | 45,117 |
| 2021 | 44,921 | 46,202 | 47,137 | 45,576 | 46,845 | 47,196 | 46,555 | 45,235 | 48,007 | 46,314 | 47,728 | 47,590 |
| 2022 | 49,628 | 48,235 | 48,337 | 46,460 | 48,015 | 49,509 | 49,124 | 47,238 | 46,846 | 48,547 | 48,442 | 46,883 |
| 2023 | 48,422 | 49,076 | 49,101 | 49,793 | 49,141 | 48,441 | 49,480 | 50,308 | 49,898 | 48,914 | 49,453 | 48,518 |
| 2024 | 48,774 | |||||||||||
| - = No Data Reported; -- = Not Applicable; NA = Not Available; W = Withheld to avoid disclosure of individual company data. |
| Release Date: 3/29/2024 |
| Next Release Date: 4/30/2024 |