|
Download Data (XLS File) |
|
||||||||
|
||||||||
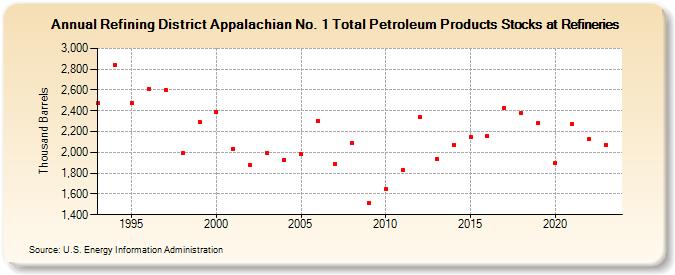
| Refining District Appalachian No. 1 Total Petroleum Products Stocks at Refineries (Thousand Barrels) | ||||||||
| Decade | Year-0 | Year-1 | Year-2 | Year-3 | Year-4 | Year-5 | Year-6 | Year-7 | Year-8 | Year-9 |
|---|---|---|---|---|---|---|---|---|---|---|
| 1990's | 2,470 | 2,839 | 2,474 | 2,610 | 2,602 | 1,989 | 2,296 | |||
| 2000's | 2,386 | 2,035 | 1,878 | 1,991 | 1,931 | 1,981 | 2,304 | 1,891 | 2,086 | 1,515 |
| 2010's | 1,645 | 1,831 | 2,339 | 1,934 | 2,074 | 2,146 | 2,156 | 2,428 | 2,376 | 2,286 |
| 2020's | 1,895 | 2,272 | 2,130 | 2,075 |
| - = No Data Reported; -- = Not Applicable; NA = Not Available; W = Withheld to avoid disclosure of individual company data. |
| Release Date: 3/29/2024 |
| Next Release Date: 8/30/2024 |
Referring Pages: