|
Download Data (XLS File) |
|
||||||||
|
||||||||
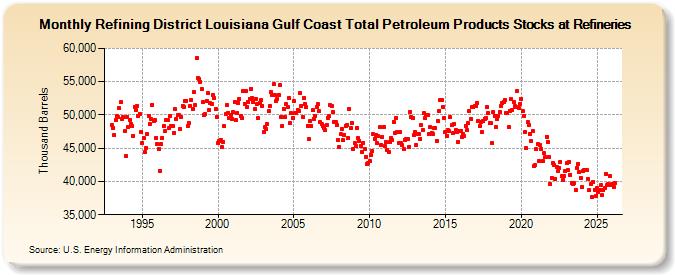
| Refining District Louisiana Gulf Coast Total Petroleum Products Stocks at Refineries (Thousand Barrels) | ||||||||
| Year | Jan | Feb | Mar | Apr | May | Jun | Jul | Aug | Sep | Oct | Nov | Dec |
|---|---|---|---|---|---|---|---|---|---|---|---|---|
| 1993 | 48,473 | 48,100 | 46,980 | 49,194 | 49,802 | 49,668 | 50,965 | 51,905 | 49,443 | 49,650 | 47,509 | 43,794 |
| 1994 | 49,753 | 48,206 | 49,258 | 48,674 | 48,355 | 46,905 | 51,223 | 50,671 | 51,370 | 49,819 | 50,184 | 47,466 |
| 1995 | 45,780 | 46,577 | 44,414 | 44,968 | 47,075 | 49,908 | 48,671 | 49,368 | 51,530 | 49,069 | 49,187 | 46,580 |
| 1996 | 45,610 | 44,899 | 41,591 | 45,556 | 46,583 | 48,294 | 47,573 | 49,205 | 49,212 | 47,976 | 49,872 | 48,356 |
| 1997 | 48,339 | 47,339 | 50,838 | 49,392 | 49,963 | 49,984 | 47,917 | 49,687 | 51,334 | 51,160 | 52,028 | 52,164 |
| 1998 | 48,305 | 48,777 | 51,350 | 52,206 | 50,844 | 53,410 | 51,470 | 58,592 | 55,560 | 55,419 | 54,988 | 53,911 |
| 1999 | 51,912 | 49,954 | 50,097 | 52,166 | 53,304 | 50,758 | 51,748 | 51,678 | 53,000 | 52,555 | 50,846 | 49,691 |
| 2000 | 45,737 | 46,103 | 46,260 | 45,137 | 45,969 | 48,334 | 50,091 | 51,481 | 50,351 | 49,612 | 49,913 | 49,436 |
| 2001 | 50,397 | 52,014 | 49,184 | 50,315 | 51,851 | 52,415 | 49,907 | 49,560 | 53,545 | 51,694 | 53,532 | 51,178 |
| 2002 | 51,979 | 52,451 | 53,960 | 52,576 | 51,902 | 50,822 | 52,440 | 51,705 | 49,480 | 51,830 | 52,221 | 51,403 |
| 2003 | 47,431 | 48,129 | 47,949 | 48,596 | 50,531 | 51,369 | 53,370 | 52,996 | 54,597 | 52,955 | 52,101 | 52,416 |
| 2004 | 53,046 | 54,537 | 49,683 | 48,389 | 50,905 | 49,632 | 51,589 | 51,251 | 52,526 | 48,801 | 50,224 | 49,503 |
| 2005 | 52,105 | 50,341 | 50,258 | 50,804 | 50,604 | 53,228 | 51,381 | 49,679 | 52,551 | 51,655 | 51,182 | 48,379 |
| 2006 | 46,397 | 49,101 | 48,374 | 50,691 | 49,448 | 49,840 | 51,213 | 51,654 | 50,518 | 48,888 | 48,685 | 48,408 |
| 2007 | 48,029 | 47,699 | 48,475 | 49,591 | 49,864 | 51,486 | 51,368 | 50,434 | 48,992 | 48,903 | 48,469 | 46,289 |
| 2008 | 45,189 | 47,073 | 47,958 | 46,166 | 47,002 | 48,390 | 48,481 | 46,512 | 50,946 | 48,004 | 48,787 | 44,894 |
| 2009 | 45,758 | 45,305 | 48,102 | 46,495 | 46,144 | 45,392 | 44,485 | 45,840 | 44,882 | 43,735 | 42,693 | 42,745 |
| 2010 | 43,062 | 43,955 | 44,524 | 47,089 | 46,406 | 47,050 | 45,764 | 46,793 | 48,139 | 45,514 | 46,705 | 48,208 |
| 2011 | 45,316 | 45,898 | 44,684 | 44,461 | 45,891 | 46,542 | 46,284 | 49,006 | 47,346 | 49,537 | 47,364 | 45,854 |
| 2012 | 47,411 | 45,716 | 45,460 | 44,859 | 46,304 | 46,445 | 46,353 | 45,150 | 50,501 | 49,711 | 49,492 | 46,921 |
| 2013 | 47,454 | 45,515 | 47,165 | 47,117 | 46,434 | 48,459 | 47,731 | 50,258 | 49,591 | 50,063 | 49,920 | 47,058 |
| 2014 | 48,119 | 47,350 | 47,186 | 48,082 | 48,049 | 46,128 | 49,074 | 50,649 | 52,169 | 52,228 | 51,249 | 49,538 |
| 2015 | 47,468 | 46,897 | 47,676 | 47,579 | 49,677 | 48,415 | 47,209 | 48,690 | 47,725 | 47,415 | 45,972 | 47,644 |
| 2016 | 47,612 | 46,676 | 47,099 | 46,819 | 48,343 | 47,709 | 48,713 | 50,534 | 49,427 | 51,161 | 51,188 | 51,326 |
| 2017 | 51,290 | 51,790 | 49,141 | 48,315 | 48,980 | 47,470 | 49,050 | 49,419 | 49,549 | 51,166 | 50,272 | 48,726 |
| 2018 | 48,782 | 45,723 | 50,462 | 49,867 | 48,150 | 49,384 | 49,867 | 50,429 | 51,342 | 51,726 | 51,911 | 52,245 |
| 2019 | 50,299 | 50,296 | 48,144 | 50,627 | 52,412 | 50,790 | 51,987 | 51,347 | 51,119 | 53,611 | 50,981 | 51,639 |
| 2020 | 52,453 | 50,535 | 49,765 | 47,467 | 45,002 | 48,939 | 48,559 | 47,147 | 46,064 | 47,585 | 42,273 | 42,443 |
| 2021 | 44,837 | 45,568 | 43,143 | 45,448 | 44,872 | 43,031 | 44,213 | 43,671 | 46,752 | 45,953 | 43,692 | 39,605 |
| 2022 | 40,559 | 42,730 | 42,539 | 40,419 | 42,134 | 41,607 | 42,046 | 42,960 | 40,760 | 40,267 | 40,844 | 41,556 |
| 2023 | 42,709 | 41,994 | 42,997 | 41,019 | 39,762 | 39,557 | 39,723 | 38,708 | 42,096 | 42,636 | 41,374 | 40,496 |
| 2024 | 39,938 | |||||||||||
| - = No Data Reported; -- = Not Applicable; NA = Not Available; W = Withheld to avoid disclosure of individual company data. |
| Release Date: 3/29/2024 |
| Next Release Date: 4/30/2024 |