|
Download Data (XLS File) |
|
||||||||
|
||||||||
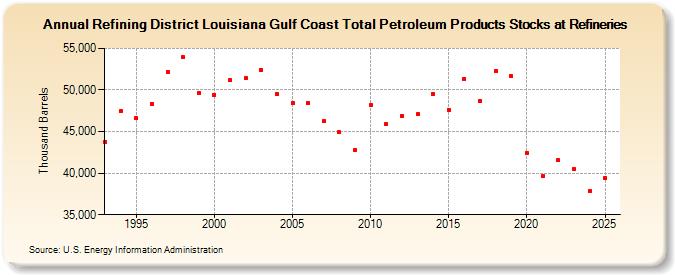
| Refining District Louisiana Gulf Coast Total Petroleum Products Stocks at Refineries (Thousand Barrels) | ||||||||
| Decade | Year-0 | Year-1 | Year-2 | Year-3 | Year-4 | Year-5 | Year-6 | Year-7 | Year-8 | Year-9 |
|---|---|---|---|---|---|---|---|---|---|---|
| 1990's | 43,794 | 47,466 | 46,580 | 48,356 | 52,164 | 53,911 | 49,691 | |||
| 2000's | 49,436 | 51,178 | 51,403 | 52,416 | 49,503 | 48,379 | 48,408 | 46,289 | 44,894 | 42,745 |
| 2010's | 48,208 | 45,854 | 46,921 | 47,058 | 49,538 | 47,644 | 51,326 | 48,726 | 52,245 | 51,639 |
| 2020's | 42,443 | 39,605 | 41,556 | 40,496 |
| - = No Data Reported; -- = Not Applicable; NA = Not Available; W = Withheld to avoid disclosure of individual company data. |
| Release Date: 3/29/2024 |
| Next Release Date: 8/30/2024 |