|
Download Data (XLS File) |
|
||||||||
|
||||||||
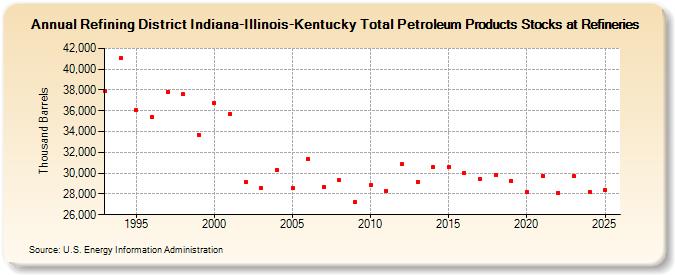
| Refining District Indiana-Illinois-Kentucky Total Petroleum Products Stocks at Refineries (Thousand Barrels) | ||||||||
| Decade | Year-0 | Year-1 | Year-2 | Year-3 | Year-4 | Year-5 | Year-6 | Year-7 | Year-8 | Year-9 |
|---|---|---|---|---|---|---|---|---|---|---|
| 1990's | 37,879 | 41,068 | 36,094 | 35,429 | 37,830 | 37,585 | 33,675 | |||
| 2000's | 36,768 | 35,723 | 29,156 | 28,590 | 30,306 | 28,553 | 31,371 | 28,677 | 29,295 | 27,243 |
| 2010's | 28,848 | 28,315 | 30,832 | 29,194 | 30,563 | 30,624 | 30,046 | 29,438 | 29,831 | 29,250 |
| 2020's | 28,213 | 29,730 | 28,126 | 29,805 |
| - = No Data Reported; -- = Not Applicable; NA = Not Available; W = Withheld to avoid disclosure of individual company data. |
| Release Date: 3/29/2024 |
| Next Release Date: 8/30/2024 |