|
Download Data (XLS File) |
|
||||||||
|
||||||||
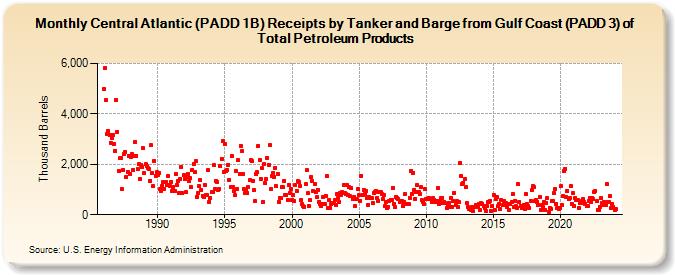
| Central Atlantic (PADD 1B) Receipts by Tanker and Barge from Gulf Coast (PADD 3) of Total Petroleum Products (Thousand Barrels) | ||||||||
| Year | Jan | Feb | Mar | Apr | May | Jun | Jul | Aug | Sep | Oct | Nov | Dec |
|---|---|---|---|---|---|---|---|---|---|---|---|---|
| 1986 | 4,993 | 5,804 | 4,535 | 3,209 | 3,338 | 3,143 | 2,860 | 3,048 | 3,161 | 2,797 | 2,542 | 4,557 |
| 1987 | 3,295 | 1,740 | 2,233 | 2,252 | 1,019 | 1,779 | 2,420 | 2,501 | 1,497 | 1,712 | 2,342 | 1,598 |
| 1988 | 2,308 | 2,418 | 1,793 | 2,320 | 2,886 | 2,343 | 1,807 | 2,000 | 1,419 | 1,963 | 1,903 | 2,632 |
| 1989 | 1,652 | 2,000 | 1,922 | 1,864 | 1,827 | 1,357 | 2,754 | 1,646 | 1,128 | 2,122 | 1,554 | 1,682 |
| 1990 | 1,576 | 1,656 | 1,007 | 941 | 1,157 | 1,287 | 1,038 | 1,293 | 1,180 | 1,537 | 1,194 | 1,140 |
| 1991 | 1,310 | 933 | 1,104 | 957 | 1,612 | 1,187 | 1,330 | 860 | 1,417 | 1,895 | 868 | 1,571 |
| 1992 | 1,420 | 883 | 1,497 | 1,619 | 1,328 | 1,445 | 1,087 | 1,774 | 2,019 | 1,704 | 2,120 | 710 |
| 1993 | 847 | 1,126 | 1,384 | 986 | 755 | 702 | 1,180 | 795 | 768 | 1,773 | 523 | 670 |
| 1994 | 896 | 887 | 1,970 | 1,016 | 1,345 | 1,300 | 984 | 1,023 | 1,916 | 2,222 | 2,913 | 1,690 |
| 1995 | 2,795 | 1,717 | 1,792 | 1,991 | 1,378 | 1,083 | 2,320 | 1,117 | 929 | 768 | 1,717 | 1,024 |
| 1996 | 2,151 | 1,621 | 2,740 | 2,508 | 1,621 | 1,038 | 855 | 961 | 869 | 1,108 | 1,367 | 2,164 |
| 1997 | 2,128 | 1,343 | 986 | 533 | 1,606 | 1,678 | 2,738 | 2,162 | 1,427 | 1,836 | 521 | 2,013 |
| 1998 | 1,247 | 1,408 | 2,248 | 1,992 | 2,747 | 1,015 | 1,523 | 1,671 | 1,505 | 1,864 | 1,124 | 1,627 |
| 1999 | 496 | 681 | 659 | 1,099 | 1,080 | 1,354 | 791 | 791 | 578 | 1,193 | 866 | 1,034 |
| 2000 | 597 | 791 | 541 | 1,174 | 944 | 1,326 | 1,290 | 1,143 | 599 | 424 | 337 | 320 |
| 2001 | 1,203 | 1,771 | 848 | 356 | 566 | 1,503 | 1,356 | 953 | 1,221 | 892 | 684 | 1,000 |
| 2002 | 524 | 424 | 342 | 430 | 696 | 423 | 752 | 1,533 | 276 | 582 | 280 | 412 |
| 2003 | 453 | 451 | 574 | 401 | 819 | 651 | 511 | 853 | 796 | 890 | 1,181 | 864 |
| 2004 | 832 | 1,186 | 791 | 1,085 | 731 | 1,055 | 619 | 689 | 339 | 607 | 608 | 1,003 |
| 2005 | 780 | 558 | 1,550 | 787 | 1,000 | 802 | 922 | 680 | 403 | 717 | 654 | 659 |
| 2006 | 471 | 848 | 914 | 933 | 657 | 552 | 885 | 888 | 823 | 617 | 776 | 329 |
| 2007 | 517 | 285 | 306 | 554 | 591 | 597 | 1,079 | 435 | 291 | 715 | 664 | 604 |
| 2008 | 509 | 546 | 550 | 330 | 509 | 816 | 414 | 422 | 417 | 673 | 1,737 | 836 |
| 2009 | 1,673 | 997 | 636 | 910 | 1,171 | 916 | 813 | 1,088 | 587 | 522 | 411 | 1,014 |
| 2010 | 627 | 630 | 681 | 616 | 627 | 495 | 661 | 594 | 493 | 527 | 1,047 | 430 |
| 2011 | 535 | 660 | 672 | 481 | 521 | 450 | 275 | 376 | 479 | 294 | 681 | 322 |
| 2012 | 543 | 878 | 400 | 558 | 321 | 488 | 2,062 | 1,543 | 1,232 | 1,278 | 1,409 | 1,093 |
| 2013 | 450 | 308 | 218 | 258 | 195 | 297 | 137 | 306 | 390 | 358 | 295 | 430 |
| 2014 | 189 | 453 | 422 | 357 | 273 | 150 | 359 | 505 | 507 | 538 | 142 | 330 |
| 2015 | 768 | 188 | 640 | 690 | 326 | 425 | 227 | 575 | 374 | 561 | 384 | 449 |
| 2016 | 313 | 420 | 183 | 413 | 496 | 826 | 307 | 556 | 335 | 283 | 1,204 | 521 |
| 2017 | 344 | 264 | 325 | 394 | 246 | 818 | 415 | 356 | 270 | 555 | 980 | 1,121 |
| 2018 | 1,101 | 554 | 601 | 516 | 397 | 709 | 188 | 371 | 292 | 502 | 186 | 470 |
| 2019 | 663 | 102 | 279 | 245 | 541 | 551 | 879 | 1,011 | 427 | 258 | 218 | 262 |
| 2020 | 1,128 | 377 | 754 | 1,742 | 1,820 | 696 | 945 | 623 | 671 | 1,133 | 416 | 871 |
| 2021 | 341 | 658 | 571 | 584 | 274 | 457 | 462 | 549 | 621 | 508 | 428 | 336 |
| 2022 | 362 | 563 | 652 | 519 | 675 | 611 | 888 | 956 | 534 | 195 | 202 | 308 |
| 2023 | 660 | 471 | 391 | 522 | 397 | 1,214 | 510 | 493 | 736 | 262 | 429 | 319 |
| 2024 | 189 | |||||||||||
| - = No Data Reported; -- = Not Applicable; NA = Not Available; W = Withheld to avoid disclosure of individual company data. |
| Release Date: 3/29/2024 |
| Next Release Date: 4/30/2024 |