|
Download Data (XLS File) |
|
||||||||
|
||||||||
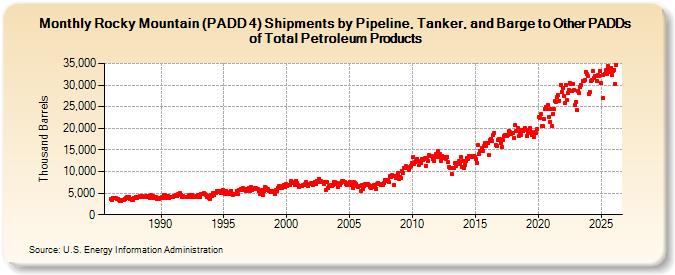
| Rocky Mountain (PADD 4) Shipments by Pipeline, Tanker, and Barge to Other PADDs of Total Petroleum Products (Thousand Barrels) | ||||||||
| Year | Jan | Feb | Mar | Apr | May | Jun | Jul | Aug | Sep | Oct | Nov | Dec |
|---|---|---|---|---|---|---|---|---|---|---|---|---|
| 1986 | 3,669 | 3,478 | 3,981 | 3,826 | 3,910 | 3,787 | 3,734 | 3,715 | 3,471 | 3,233 | 3,225 | 3,409 |
| 1987 | 3,451 | 3,442 | 3,527 | 3,789 | 4,205 | 4,063 | 3,722 | 3,704 | 3,485 | 3,375 | 3,811 | 3,929 |
| 1988 | 4,174 | 3,876 | 4,058 | 4,055 | 4,436 | 4,302 | 4,353 | 4,160 | 4,148 | 4,084 | 4,326 | 4,081 |
| 1989 | 4,345 | 3,880 | 4,561 | 4,207 | 4,445 | 3,857 | 4,122 | 4,006 | 3,712 | 3,868 | 3,713 | 3,798 |
| 1990 | 3,968 | 4,104 | 3,944 | 4,463 | 4,512 | 4,104 | 3,778 | 4,294 | 3,825 | 4,119 | 3,994 | 4,062 |
| 1991 | 4,263 | 4,428 | 4,648 | 4,348 | 4,720 | 4,776 | 5,071 | 4,649 | 4,094 | 4,233 | 4,182 | 4,183 |
| 1992 | 4,156 | 4,181 | 4,016 | 4,481 | 4,551 | 4,170 | 4,671 | 4,085 | 4,133 | 4,296 | 4,099 | 4,536 |
| 1993 | 4,256 | 4,119 | 4,886 | 4,778 | 4,901 | 4,916 | 4,743 | 4,647 | 4,153 | 4,249 | 3,831 | 3,652 |
| 1994 | 4,515 | 4,239 | 5,016 | 4,500 | 5,001 | 5,498 | 5,293 | 5,530 | 5,516 | 5,033 | 5,365 | 5,729 |
| 1995 | 5,528 | 4,698 | 5,520 | 5,253 | 5,104 | 4,776 | 4,956 | 5,495 | 4,769 | 4,674 | 4,690 | 4,685 |
| 1996 | 5,568 | 4,718 | 5,829 | 5,812 | 6,007 | 5,752 | 6,114 | 5,938 | 5,988 | 5,597 | 5,875 | 5,789 |
| 1997 | 6,116 | 5,583 | 6,410 | 5,610 | 5,885 | 6,059 | 6,127 | 6,111 | 5,927 | 5,419 | 4,858 | 4,956 |
| 1998 | 5,727 | 4,632 | 5,568 | 6,364 | 6,284 | 5,794 | 5,912 | 5,514 | 5,374 | 5,313 | 5,418 | 5,403 |
| 1999 | 5,579 | 4,712 | 5,712 | 5,509 | 6,113 | 6,706 | 6,234 | 6,232 | 6,651 | 6,824 | 6,305 | 7,107 |
| 2000 | 6,553 | 6,766 | 6,968 | 6,851 | 7,730 | 7,523 | 7,382 | 7,428 | 6,869 | 7,869 | 7,299 | 6,812 |
| 2001 | 6,443 | 6,688 | 6,561 | 6,779 | 6,917 | 7,001 | 7,532 | 7,105 | 6,659 | 7,117 | 7,198 | 7,247 |
| 2002 | 7,135 | 6,810 | 7,379 | 7,571 | 7,042 | 7,709 | 7,501 | 8,209 | 7,521 | 7,701 | 7,632 | 7,111 |
| 2003 | 7,656 | 5,613 | 7,520 | 6,184 | 6,553 | 6,687 | 6,869 | 6,571 | 6,790 | 7,560 | 7,503 | 7,063 |
| 2004 | 7,331 | 6,492 | 7,110 | 6,950 | 7,265 | 7,687 | 7,847 | 7,586 | 7,065 | 6,813 | 7,206 | 7,375 |
| 2005 | 7,482 | 6,963 | 6,977 | 6,207 | 7,583 | 7,401 | 7,144 | 6,627 | 6,415 | 6,541 | 6,611 | 5,598 |
| 2006 | 6,948 | 5,997 | 6,651 | 7,099 | 6,945 | 7,137 | 6,927 | 6,521 | 6,241 | 6,439 | 6,738 | 6,839 |
| 2007 | 6,757 | 6,022 | 7,022 | 7,422 | 7,178 | 7,068 | 6,896 | 7,150 | 6,924 | 7,426 | 8,046 | 7,692 |
| 2008 | 8,066 | 7,514 | 8,854 | 8,776 | 9,150 | 9,035 | 6,911 | 9,003 | 8,433 | 8,939 | 9,680 | 8,167 |
| 2009 | 8,793 | 8,456 | 10,213 | 9,646 | 10,904 | 10,738 | 11,214 | 10,771 | 10,447 | 11,013 | 11,351 | 11,869 |
| 2010 | 13,251 | 11,845 | 12,222 | 12,332 | 12,976 | 12,318 | 11,432 | 11,995 | 11,998 | 12,780 | 12,662 | 12,916 |
| 2011 | 13,038 | 11,373 | 13,045 | 12,444 | 13,721 | 13,542 | 13,665 | 12,872 | 12,541 | 13,339 | 14,043 | 13,812 |
| 2012 | 14,652 | 13,459 | 14,064 | 12,412 | 13,680 | 13,211 | 13,182 | 13,451 | 12,840 | 13,461 | 12,116 | 11,126 |
| 2013 | 10,796 | 9,363 | 10,778 | 10,838 | 11,904 | 11,168 | 12,036 | 12,040 | 12,421 | 11,742 | 13,441 | 11,081 |
| 2014 | 12,329 | 10,780 | 11,584 | 12,437 | 13,140 | 12,904 | 13,547 | 13,665 | 13,523 | 13,347 | 13,491 | 13,358 |
| 2015 | 12,980 | 12,068 | 16,031 | 14,012 | 14,847 | 14,646 | 15,437 | 14,691 | 15,853 | 16,589 | 15,938 | 16,636 |
| 2016 | 16,487 | 13,799 | 17,300 | 17,623 | 17,164 | 18,455 | 18,932 | 16,198 | 15,897 | 17,406 | 17,429 | 17,413 |
| 2017 | 16,489 | 15,636 | 17,369 | 18,132 | 18,415 | 18,194 | 18,241 | 18,554 | 19,295 | 19,120 | 18,660 | 18,841 |
| 2018 | 18,834 | 17,781 | 20,808 | 19,482 | 20,140 | 18,140 | 19,057 | 18,508 | 19,647 | 19,343 | 19,641 | 20,018 |
| 2019 | 19,570 | 18,320 | 18,958 | 19,519 | 20,103 | 19,046 | 18,376 | 18,614 | 18,011 | 19,248 | 18,814 | 19,949 |
| 2020 | 22,715 | 22,461 | 23,205 | 20,605 | 20,632 | 22,214 | 24,442 | 25,033 | 24,374 | 25,364 | 22,709 | 21,525 |
| 2021 | 24,444 | 20,416 | 23,313 | 24,373 | 26,303 | 26,113 | 27,165 | 27,607 | 26,374 | 30,101 | 28,450 | 29,413 |
| 2022 | 27,497 | 25,744 | 29,953 | 26,509 | 28,244 | 28,825 | 30,531 | 30,351 | 28,578 | 30,261 | 28,847 | 25,496 |
| 2023 | 26,169 | 24,233 | 28,608 | 28,117 | 29,489 | 29,944 | 31,041 | 30,859 | 31,108 | 33,086 | 32,447 | 32,021 |
| 2024 | 27,819 | 28,461 | ||||||||||
| - = No Data Reported; -- = Not Applicable; NA = Not Available; W = Withheld to avoid disclosure of individual company data. |
| Release Date: 4/30/2024 |
| Next Release Date: 5/31/2024 |
Referring Pages: