|
Download Data (XLS File) |
|
||||||||
|
||||||||
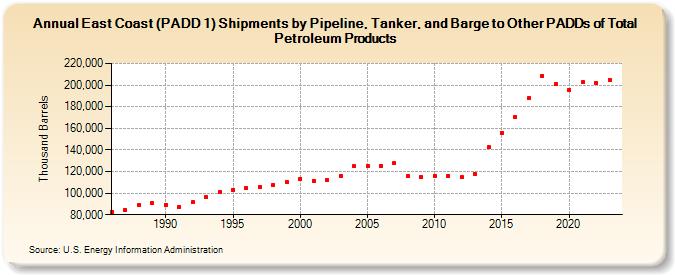
| East Coast (PADD 1) Shipments by Pipeline, Tanker, and Barge to Other PADDs of Total Petroleum Products (Thousand Barrels) | ||||||||
| Decade | Year-0 | Year-1 | Year-2 | Year-3 | Year-4 | Year-5 | Year-6 | Year-7 | Year-8 | Year-9 |
|---|---|---|---|---|---|---|---|---|---|---|
| 1980's | 82,781 | 84,192 | 89,106 | 90,547 | ||||||
| 1990's | 89,385 | 87,570 | 91,486 | 96,492 | 100,798 | 103,238 | 104,616 | 106,066 | 107,430 | 110,097 |
| 2000's | 113,424 | 111,361 | 111,999 | 115,945 | 124,862 | 125,406 | 125,023 | 127,588 | 115,438 | 114,723 |
| 2010's | 115,984 | 116,166 | 114,660 | 117,768 | 142,262 | 156,006 | 170,377 | 187,853 | 208,598 | 200,814 |
| 2020's | 195,803 | 202,706 | 202,237 | 205,147 |
| - = No Data Reported; -- = Not Applicable; NA = Not Available; W = Withheld to avoid disclosure of individual company data. |
| Release Date: 3/29/2024 |
| Next Release Date: 8/30/2024 |