|
Download Data (XLS File) |
|
||||||||
|
||||||||
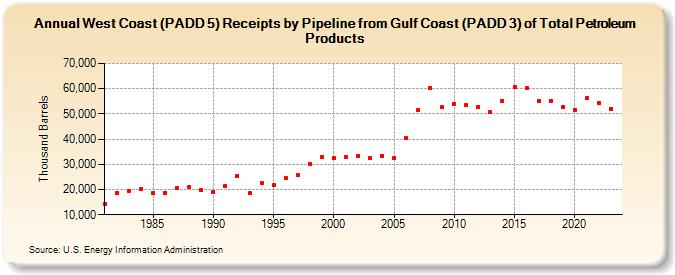
| West Coast (PADD 5) Receipts by Pipeline from Gulf Coast (PADD 3) of Total Petroleum Products (Thousand Barrels) | ||||||||
| Decade | Year-0 | Year-1 | Year-2 | Year-3 | Year-4 | Year-5 | Year-6 | Year-7 | Year-8 | Year-9 |
|---|---|---|---|---|---|---|---|---|---|---|
| 1980's | 14,093 | 18,635 | 19,531 | 20,303 | 18,778 | 18,800 | 20,461 | 21,064 | 19,713 | |
| 1990's | 19,184 | 21,312 | 25,530 | 18,581 | 22,645 | 21,742 | 24,659 | 25,704 | 30,270 | 32,781 |
| 2000's | 32,314 | 32,984 | 33,411 | 32,531 | 33,204 | 32,326 | 40,250 | 51,654 | 60,303 | 52,563 |
| 2010's | 53,958 | 53,619 | 52,843 | 50,663 | 55,171 | 60,687 | 60,154 | 55,049 | 55,048 | 52,807 |
| 2020's | 51,681 | 56,108 | 54,229 | 52,136 |
| - = No Data Reported; -- = Not Applicable; NA = Not Available; W = Withheld to avoid disclosure of individual company data. |
| Release Date: 3/29/2024 |
| Next Release Date: 8/30/2024 |