|
Download Data (XLS File) |
|
||||||||
|
||||||||
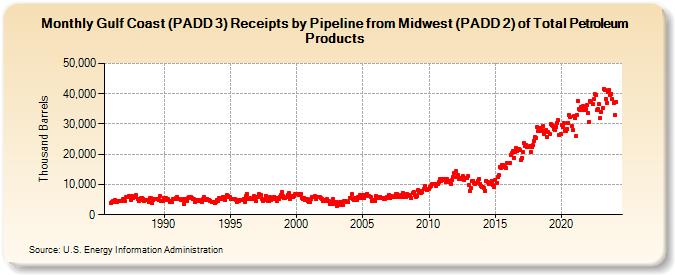
| Gulf Coast (PADD 3) Receipts by Pipeline from Midwest (PADD 2) of Total Petroleum Products (Thousand Barrels) | ||||||||
| Year | Jan | Feb | Mar | Apr | May | Jun | Jul | Aug | Sep | Oct | Nov | Dec |
|---|---|---|---|---|---|---|---|---|---|---|---|---|
| 1986 | 3,942 | 4,084 | 4,645 | 4,315 | 4,818 | 4,043 | 4,370 | 4,622 | 4,454 | 4,563 | 4,644 | 5,129 |
| 1987 | 4,653 | 4,389 | 5,918 | 5,956 | 6,036 | 5,860 | 4,837 | 6,068 | 5,681 | 5,923 | 5,738 | 6,379 |
| 1988 | 5,105 | 4,443 | 4,889 | 5,379 | 5,576 | 5,360 | 4,474 | 4,832 | 4,892 | 4,892 | 4,167 | 5,482 |
| 1989 | 5,392 | 3,885 | 4,780 | 5,271 | 5,143 | 5,349 | 5,139 | 4,857 | 6,052 | 4,528 | 4,695 | 4,675 |
| 1990 | 5,454 | 5,080 | 5,437 | 4,853 | 5,039 | 4,242 | 4,685 | 4,364 | 5,124 | 5,175 | 5,246 | 5,391 |
| 1991 | 5,900 | 5,347 | 5,219 | 5,015 | 4,704 | 5,231 | 3,488 | 5,194 | 4,510 | 4,389 | 5,490 | 5,830 |
| 1992 | 5,856 | 5,445 | 5,057 | 5,248 | 4,064 | 4,928 | 4,974 | 4,620 | 4,824 | 4,563 | 4,210 | 5,175 |
| 1993 | 5,891 | 4,903 | 5,231 | 5,288 | 4,845 | 4,894 | 4,683 | 4,311 | 4,046 | 4,150 | 3,973 | 4,129 |
| 1994 | 5,028 | 4,430 | 5,616 | 5,252 | 5,334 | 5,975 | 5,305 | 5,028 | 5,743 | 6,384 | 6,177 | 5,888 |
| 1995 | 5,768 | 5,034 | 5,078 | 5,179 | 5,360 | 4,993 | 4,338 | 4,884 | 4,525 | 4,781 | 4,987 | 4,915 |
| 1996 | 5,146 | 4,274 | 6,108 | 6,903 | 5,273 | 5,345 | 5,459 | 5,094 | 5,321 | 6,063 | 5,105 | 4,408 |
| 1997 | 5,931 | 5,756 | 6,845 | 6,368 | 6,475 | 5,077 | 4,653 | 4,823 | 6,281 | 4,700 | 4,559 | 4,635 |
| 1998 | 5,765 | 4,970 | 5,622 | 5,160 | 5,986 | 5,526 | 4,585 | 5,567 | 5,191 | 6,005 | 6,612 | 7,483 |
| 1999 | 6,030 | 5,566 | 5,649 | 5,732 | 6,450 | 7,143 | 5,078 | 5,837 | 6,308 | 5,874 | 6,140 | 6,740 |
| 2000 | 6,991 | 6,844 | 6,533 | 6,930 | 6,885 | 5,456 | 5,084 | 5,548 | 4,927 | 5,044 | 4,432 | 4,281 |
| 2001 | 4,298 | 5,094 | 5,791 | 5,761 | 5,968 | 6,202 | 5,331 | 5,799 | 5,993 | 5,732 | 5,400 | 5,148 |
| 2002 | 4,392 | 4,426 | 4,845 | 4,415 | 5,072 | 4,559 | 3,572 | 4,162 | 3,628 | 5,238 | 3,954 | 3,456 |
| 2003 | 4,325 | 2,914 | 4,034 | 4,193 | 3,287 | 4,083 | 3,364 | 4,694 | 4,448 | 4,390 | 4,045 | 4,213 |
| 2004 | 5,664 | 5,465 | 6,823 | 5,342 | 4,940 | 5,681 | 5,582 | 4,800 | 5,827 | 6,390 | 5,512 | 5,980 |
| 2005 | 6,384 | 5,584 | 6,379 | 6,313 | 6,991 | 6,083 | 6,174 | 5,789 | 4,656 | 4,965 | 4,809 | 4,401 |
| 2006 | 6,036 | 5,633 | 5,647 | 5,750 | 5,991 | 5,431 | 5,457 | 5,116 | 5,226 | 5,553 | 5,933 | 5,986 |
| 2007 | 6,513 | 5,380 | 6,160 | 5,969 | 5,984 | 6,253 | 6,692 | 6,779 | 5,830 | 6,066 | 5,895 | 6,527 |
| 2008 | 7,209 | 5,856 | 6,668 | 5,909 | 6,966 | 6,622 | 6,614 | 6,254 | 5,516 | 7,224 | 7,652 | 6,496 |
| 2009 | 5,872 | 6,335 | 8,205 | 7,412 | 7,780 | 7,232 | 7,529 | 8,366 | 9,493 | 8,626 | 8,224 | 8,441 |
| 2010 | 8,603 | 9,194 | 9,384 | 10,133 | 10,096 | 10,072 | 9,487 | 10,208 | 10,156 | 10,925 | 11,923 | 11,231 |
| 2011 | 11,696 | 11,624 | 11,965 | 10,668 | 11,883 | 11,108 | 10,890 | 11,019 | 10,118 | 11,619 | 12,572 | 13,942 |
| 2012 | 14,329 | 12,331 | 13,089 | 11,954 | 12,004 | 12,065 | 11,844 | 12,639 | 11,462 | 12,181 | 12,271 | 12,651 |
| 2013 | 9,864 | 7,986 | 8,988 | 11,036 | 11,260 | 10,483 | 10,087 | 10,511 | 11,191 | 11,709 | 10,223 | 9,336 |
| 2014 | 9,217 | 9,110 | 8,759 | 7,955 | 11,256 | 10,705 | 10,169 | 10,111 | 10,394 | 11,286 | 9,671 | 9,289 |
| 2015 | 11,437 | 10,328 | 12,501 | 13,046 | 15,867 | 15,566 | 16,530 | 16,445 | 15,798 | 15,618 | 15,455 | 17,257 |
| 2016 | 17,107 | 17,188 | 19,839 | 20,289 | 20,919 | 18,850 | 20,761 | 21,895 | 21,016 | 21,711 | 21,550 | 18,204 |
| 2017 | 18,911 | 20,794 | 23,581 | 22,654 | 23,057 | 22,383 | 22,520 | 22,702 | 20,680 | 22,261 | 23,051 | 24,371 |
| 2018 | 25,592 | 25,374 | 28,860 | 27,685 | 28,762 | 27,811 | 27,961 | 29,209 | 26,743 | 27,557 | 27,995 | 25,691 |
| 2019 | 27,301 | 26,760 | 29,933 | 29,810 | 29,398 | 28,217 | 27,948 | 29,075 | 30,195 | 31,288 | 26,397 | 26,696 |
| 2020 | 29,651 | 29,164 | 30,287 | 27,839 | 27,794 | 28,329 | 30,483 | 32,878 | 32,297 | 29,346 | 27,889 | 32,534 |
| 2021 | 31,839 | 25,889 | 33,070 | 37,664 | 34,919 | 34,765 | 35,710 | 35,842 | 34,528 | 34,750 | 35,065 | 36,397 |
| 2022 | 33,696 | 30,778 | 37,521 | 37,185 | 36,526 | 38,179 | 39,819 | 39,724 | 34,500 | 35,010 | 36,537 | 31,994 |
| 2023 | 34,087 | 35,433 | 41,700 | 41,170 | 38,339 | 37,064 | 40,539 | 41,308 | 39,595 | 40,075 | 38,190 | 37,001 |
| 2024 | 32,915 | |||||||||||
| - = No Data Reported; -- = Not Applicable; NA = Not Available; W = Withheld to avoid disclosure of individual company data. |
| Release Date: 3/29/2024 |
| Next Release Date: 4/30/2024 |