|
Download Data (XLS File) |
|
||||||||
|
||||||||
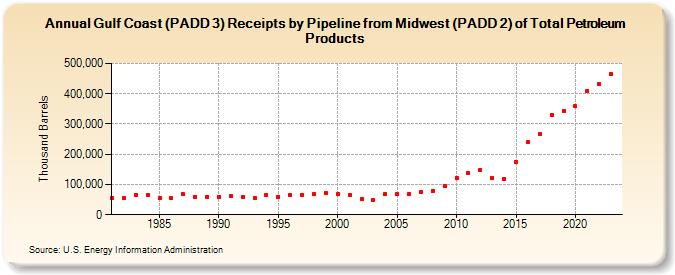
| Gulf Coast (PADD 3) Receipts by Pipeline from Midwest (PADD 2) of Total Petroleum Products (Thousand Barrels) | ||||||||
| Decade | Year-0 | Year-1 | Year-2 | Year-3 | Year-4 | Year-5 | Year-6 | Year-7 | Year-8 | Year-9 |
|---|---|---|---|---|---|---|---|---|---|---|
| 1980's | 54,571 | 54,957 | 65,788 | 66,240 | 54,962 | 53,629 | 67,438 | 59,491 | 59,766 | |
| 1990's | 60,090 | 60,317 | 58,964 | 56,344 | 66,160 | 59,842 | 64,499 | 66,103 | 68,472 | 72,547 |
| 2000's | 68,955 | 66,517 | 51,719 | 47,990 | 68,006 | 68,528 | 67,759 | 74,048 | 78,986 | 93,515 |
| 2010's | 121,412 | 139,104 | 148,820 | 122,674 | 117,922 | 175,848 | 239,329 | 266,965 | 329,240 | 343,018 |
| 2020's | 358,491 | 410,438 | 431,469 | 464,501 |
| - = No Data Reported; -- = Not Applicable; NA = Not Available; W = Withheld to avoid disclosure of individual company data. |
| Release Date: 3/29/2024 |
| Next Release Date: 8/30/2024 |