|
Download Data (XLS File) |
|
||||||||
|
||||||||
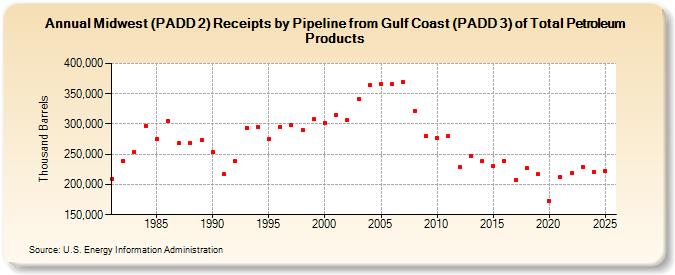
| Midwest (PADD 2) Receipts by Pipeline from Gulf Coast (PADD 3) of Total Petroleum Products (Thousand Barrels) | ||||||||
| Decade | Year-0 | Year-1 | Year-2 | Year-3 | Year-4 | Year-5 | Year-6 | Year-7 | Year-8 | Year-9 |
|---|---|---|---|---|---|---|---|---|---|---|
| 1980's | 208,870 | 238,862 | 254,382 | 297,157 | 275,772 | 304,856 | 267,915 | 269,125 | 274,127 | |
| 1990's | 252,976 | 216,652 | 237,977 | 294,045 | 295,613 | 275,275 | 295,661 | 298,639 | 289,953 | 307,773 |
| 2000's | 301,273 | 314,974 | 306,947 | 340,961 | 363,680 | 365,779 | 365,272 | 369,178 | 322,273 | 280,870 |
| 2010's | 277,555 | 279,358 | 228,314 | 246,795 | 238,124 | 229,739 | 239,429 | 208,209 | 227,047 | 216,580 |
| 2020's | 173,326 | 212,278 | 218,589 | 229,506 |
| - = No Data Reported; -- = Not Applicable; NA = Not Available; W = Withheld to avoid disclosure of individual company data. |
| Release Date: 3/29/2024 |
| Next Release Date: 8/30/2024 |