|
Download Data (XLS File) |
|
||||||||
|
||||||||
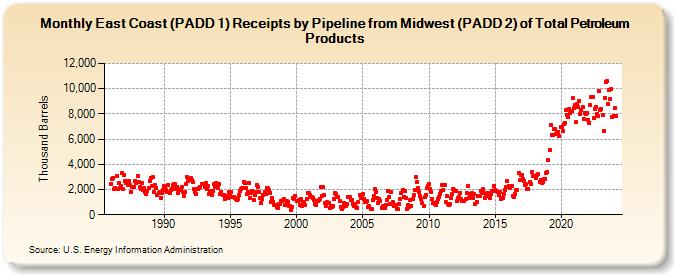
| East Coast (PADD 1) Receipts by Pipeline from Midwest (PADD 2) of Total Petroleum Products (Thousand Barrels) | ||||||||
| Year | Jan | Feb | Mar | Apr | May | Jun | Jul | Aug | Sep | Oct | Nov | Dec |
|---|---|---|---|---|---|---|---|---|---|---|---|---|
| 1986 | 2,466 | 2,795 | 2,933 | 2,075 | 2,153 | 3,081 | 2,015 | 2,502 | 2,103 | 2,297 | 3,277 | 2,026 |
| 1987 | 3,159 | 2,689 | 2,542 | 2,330 | 2,688 | 2,384 | 1,826 | 2,236 | 2,182 | 2,209 | 2,669 | 2,488 |
| 1988 | 3,079 | 2,626 | 2,228 | 2,050 | 2,490 | 1,942 | 2,088 | 1,825 | 1,639 | 1,892 | 2,146 | 2,697 |
| 1989 | 2,910 | 2,253 | 2,963 | 1,816 | 2,322 | 2,143 | 1,586 | 1,734 | 1,786 | 1,350 | 1,741 | 1,980 |
| 1990 | 2,277 | 2,203 | 1,952 | 1,824 | 2,383 | 1,717 | 1,935 | 2,028 | 2,344 | 2,449 | 2,422 | 2,066 |
| 1991 | 2,204 | 1,692 | 1,950 | 2,045 | 2,172 | 1,779 | 1,498 | 1,781 | 2,476 | 2,965 | 2,673 | 2,817 |
| 1992 | 2,886 | 2,777 | 2,566 | 2,051 | 1,842 | 1,670 | 2,013 | 2,080 | 2,135 | 2,191 | 2,421 | 2,455 |
| 1993 | 2,476 | 2,219 | 2,515 | 2,068 | 2,264 | 1,631 | 1,895 | 1,603 | 1,889 | 2,431 | 2,213 | 2,549 |
| 1994 | 2,407 | 2,146 | 2,415 | 1,635 | 1,806 | 1,594 | 1,546 | 1,274 | 1,478 | 1,429 | 1,309 | 1,781 |
| 1995 | 1,635 | 1,840 | 1,371 | 1,403 | 1,351 | 1,282 | 1,179 | 1,238 | 1,532 | 1,863 | 2,038 | 2,150 |
| 1996 | 2,608 | 2,520 | 2,115 | 1,640 | 1,832 | 2,522 | 1,362 | 1,708 | 1,885 | 1,167 | 1,550 | 1,829 |
| 1997 | 2,353 | 2,196 | 1,763 | 1,323 | 915 | 1,277 | 1,580 | 1,835 | 1,664 | 2,127 | 2,107 | 1,930 |
| 1998 | 1,760 | 1,002 | 1,326 | 1,044 | 794 | 752 | 579 | 553 | 854 | 864 | 1,061 | 1,127 |
| 1999 | 1,136 | 1,211 | 798 | 1,064 | 984 | 708 | 671 | 398 | 588 | 1,364 | 1,228 | 1,493 |
| 2000 | 1,115 | 1,054 | 1,143 | 764 | 1,216 | 672 | 1,003 | 983 | 770 | 1,248 | 1,717 | 1,719 |
| 2001 | 1,570 | 1,418 | 1,375 | 1,328 | 1,130 | 857 | 808 | 1,071 | 1,128 | 1,235 | 2,201 | 1,514 |
| 2002 | 2,189 | 1,578 | 913 | 716 | 973 | 898 | 554 | 682 | 610 | 678 | 1,270 | 1,745 |
| 2003 | 1,623 | 1,380 | 1,430 | 1,108 | 612 | 453 | 610 | 891 | 771 | 697 | 832 | 1,422 |
| 2004 | 1,443 | 1,207 | 1,148 | 861 | 721 | 868 | 588 | 520 | 982 | 1,582 | 1,365 | 1,531 |
| 2005 | 1,673 | 1,253 | 1,028 | 1,010 | 1,083 | 587 | 667 | 454 | 469 | 1,184 | 1,506 | 2,012 |
| 2006 | 1,824 | 1,300 | 962 | 1,224 | 1,105 | 547 | 687 | 640 | 497 | 793 | 1,156 | 1,846 |
| 2007 | 1,445 | 843 | 1,806 | 1,008 | 688 | 775 | 664 | 488 | 425 | 883 | 1,243 | 1,747 |
| 2008 | 1,970 | 1,445 | 1,865 | 1,364 | 489 | 783 | 586 | 1,144 | 726 | 1,272 | 1,548 | 1,995 |
| 2009 | 2,993 | 2,592 | 2,089 | 1,801 | 1,483 | 1,237 | 894 | 664 | 1,374 | 1,589 | 2,114 | 2,292 |
| 2010 | 2,407 | 2,013 | 1,813 | 1,246 | 964 | 848 | 807 | 989 | 1,251 | 1,420 | 1,624 | 1,860 |
| 2011 | 2,373 | 1,932 | 2,342 | 1,018 | 1,458 | 835 | 799 | 845 | 1,362 | 1,678 | 2,073 | 1,967 |
| 2012 | 1,910 | 1,087 | 1,333 | 1,367 | 1,724 | 1,246 | 1,127 | 1,117 | 1,072 | 1,222 | 1,739 | 2,259 |
| 2013 | 1,365 | 1,653 | 1,479 | 1,701 | 1,322 | 1,653 | 819 | 1,028 | 1,476 | 1,512 | 1,490 | 1,871 |
| 2014 | 1,797 | 2,001 | 1,702 | 1,349 | 1,490 | 1,726 | 1,462 | 1,340 | 1,617 | 1,871 | 1,848 | 2,313 |
| 2015 | 1,988 | 1,886 | 1,826 | 1,564 | 1,794 | 1,269 | 1,337 | 1,358 | 1,644 | 1,960 | 2,215 | 2,669 |
| 2016 | 2,287 | 2,081 | 2,285 | 2,271 | 1,486 | 1,428 | 1,615 | 1,972 | 1,930 | 3,338 | 2,727 | 3,147 |
| 2017 | 3,128 | 2,819 | 2,666 | 2,331 | 2,403 | 2,051 | 2,061 | 2,622 | 2,441 | 3,363 | 3,041 | 3,051 |
| 2018 | 3,064 | 2,889 | 3,176 | 3,200 | 2,629 | 2,792 | 2,522 | 2,571 | 2,858 | 2,873 | 3,331 | 3,423 |
| 2019 | 4,334 | 5,140 | 7,130 | 6,287 | 6,314 | 6,809 | 6,818 | 6,382 | 6,488 | 6,595 | 6,223 | 6,959 |
| 2020 | 6,921 | 6,655 | 7,176 | 7,307 | 8,337 | 7,915 | 7,722 | 8,413 | 8,079 | 8,217 | 9,297 | 8,504 |
| 2021 | 8,712 | 7,338 | 8,779 | 8,555 | 9,000 | 8,016 | 8,277 | 8,536 | 7,618 | 8,092 | 8,010 | 8,084 |
| 2022 | 7,515 | 7,315 | 8,681 | 9,379 | 9,332 | 7,664 | 8,426 | 8,549 | 7,986 | 7,834 | 9,782 | 8,312 |
| 2023 | 8,359 | 7,875 | 6,645 | 9,274 | 10,493 | 10,581 | 8,813 | 9,863 | 9,155 | 10,008 | 7,744 | 7,869 |
| 2024 | 8,458 | |||||||||||
| - = No Data Reported; -- = Not Applicable; NA = Not Available; W = Withheld to avoid disclosure of individual company data. |
| Release Date: 3/29/2024 |
| Next Release Date: 4/30/2024 |