|
Download Data (XLS File) |
|
||||||||
|
||||||||
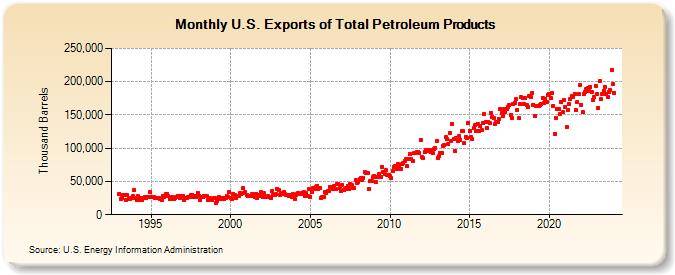
| U.S. Exports of Total Petroleum Products (Thousand Barrels) | ||||||||
| Year | Jan | Feb | Mar | Apr | May | Jun | Jul | Aug | Sep | Oct | Nov | Dec |
|---|---|---|---|---|---|---|---|---|---|---|---|---|
| 1993 | 31,193 | 24,278 | 25,761 | 29,826 | 30,061 | 22,492 | 29,087 | 23,997 | 23,853 | 25,391 | 27,387 | 36,814 |
| 1994 | 25,335 | 21,446 | 27,765 | 22,459 | 25,164 | 22,806 | 24,590 | 26,065 | 24,906 | 26,615 | 26,946 | 33,779 |
| 1995 | 26,815 | 27,073 | 27,283 | 25,274 | 24,906 | 24,546 | 24,546 | 23,541 | 21,920 | 28,276 | 26,532 | 31,255 |
| 1996 | 30,418 | 27,714 | 23,952 | 24,832 | 26,478 | 22,974 | 24,973 | 26,412 | 28,705 | 28,252 | 25,562 | 28,413 |
| 1997 | 27,794 | 22,048 | 24,685 | 25,339 | 26,371 | 26,938 | 29,210 | 29,884 | 26,238 | 28,342 | 27,045 | 33,056 |
| 1998 | 27,975 | 22,568 | 26,301 | 26,545 | 28,179 | 27,732 | 27,722 | 22,603 | 24,840 | 23,662 | 21,643 | 24,884 |
| 1999 | 24,431 | 17,821 | 20,734 | 25,911 | 25,616 | 23,534 | 24,741 | 23,849 | 25,857 | 27,513 | 25,988 | 33,990 |
| 2000 | 25,736 | 24,347 | 31,468 | 30,223 | 25,484 | 27,463 | 27,436 | 32,735 | 31,076 | 39,781 | 33,167 | 33,443 |
| 2001 | 29,024 | 27,451 | 27,928 | 28,114 | 31,147 | 28,814 | 26,914 | 31,619 | 24,515 | 28,987 | 28,523 | 34,000 |
| 2002 | 26,342 | 32,764 | 26,186 | 26,459 | 27,994 | 26,229 | 24,990 | 35,007 | 30,245 | 29,696 | 30,491 | 39,377 |
| 2003 | 37,252 | 29,733 | 32,293 | 31,220 | 33,553 | 30,590 | 30,035 | 29,243 | 28,690 | 29,645 | 27,337 | 30,579 |
| 2004 | 23,011 | 30,097 | 31,150 | 32,962 | 31,800 | 30,738 | 32,919 | 33,407 | 27,795 | 32,622 | 28,495 | 38,857 |
| 2005 | 27,178 | 34,632 | 39,443 | 38,540 | 41,075 | 43,673 | 37,978 | 39,629 | 24,579 | 25,948 | 27,373 | 33,524 |
| 2006 | 31,988 | 35,306 | 35,353 | 41,160 | 41,017 | 39,037 | 42,586 | 38,430 | 45,995 | 45,549 | 39,880 | 35,260 |
| 2007 | 44,518 | 37,088 | 38,463 | 40,222 | 43,548 | 38,376 | 45,855 | 44,661 | 39,814 | 40,743 | 52,398 | 47,188 |
| 2008 | 49,846 | 53,010 | 55,111 | 51,749 | 54,998 | 63,730 | 62,694 | 62,413 | 38,503 | 50,063 | 50,693 | 56,120 |
| 2009 | 58,445 | 49,782 | 56,025 | 56,211 | 60,833 | 57,182 | 71,823 | 64,595 | 61,886 | 66,666 | 59,505 | 59,865 |
| 2010 | 57,789 | 55,328 | 65,227 | 71,879 | 73,251 | 68,180 | 75,859 | 73,606 | 68,499 | 76,152 | 77,002 | 80,716 |
| 2011 | 83,029 | 72,919 | 83,583 | 90,915 | 83,640 | 80,408 | 92,374 | 92,028 | 94,158 | 94,759 | 92,834 | 112,042 |
| 2012 | 86,532 | 84,698 | 94,396 | 96,925 | 96,857 | 95,092 | 97,974 | 93,660 | 92,873 | 98,818 | 99,922 | 110,525 |
| 2013 | 85,936 | 88,131 | 93,137 | 92,890 | 103,584 | 104,087 | 116,153 | 113,271 | 105,785 | 122,610 | 111,421 | 135,815 |
| 2014 | 113,553 | 95,509 | 115,986 | 110,777 | 117,928 | 112,815 | 125,337 | 126,039 | 107,931 | 116,500 | 114,965 | 138,597 |
| 2015 | 126,495 | 117,542 | 113,283 | 130,160 | 134,098 | 126,342 | 136,841 | 125,444 | 133,225 | 127,610 | 137,506 | 151,091 |
| 2016 | 139,109 | 129,925 | 139,368 | 137,142 | 153,508 | 147,194 | 145,402 | 135,661 | 139,939 | 138,969 | 144,608 | 158,269 |
| 2017 | 152,936 | 148,803 | 158,836 | 154,490 | 159,139 | 161,607 | 165,394 | 150,292 | 144,766 | 166,352 | 167,997 | 174,025 |
| 2018 | 158,070 | 144,807 | 166,395 | 176,329 | 175,147 | 166,346 | 175,330 | 164,462 | 161,995 | 178,396 | 176,414 | 183,222 |
| 2019 | 165,519 | 148,521 | 163,448 | 164,145 | 163,655 | 164,293 | 166,723 | 176,161 | 167,375 | 174,450 | 169,830 | 179,605 |
| 2020 | 181,058 | 175,516 | 182,808 | 164,115 | 121,970 | 145,820 | 159,395 | 159,390 | 151,499 | 168,949 | 153,796 | 172,592 |
| 2021 | 162,644 | 132,320 | 157,714 | 166,038 | 174,401 | 178,531 | 177,613 | 182,107 | 157,144 | 168,864 | 181,455 | 195,341 |
| 2022 | 165,417 | 153,734 | 182,091 | 184,807 | 188,269 | 190,319 | 185,842 | 191,673 | 184,159 | 172,759 | 176,191 | 194,159 |
| 2023 | 181,438 | 160,661 | 200,354 | 173,180 | 181,754 | 186,218 | 192,016 | 181,564 | 177,077 | 184,181 | 187,644 | 217,522 |
| 2024 | 196,010 | |||||||||||
| - = No Data Reported; -- = Not Applicable; NA = Not Available; W = Withheld to avoid disclosure of individual company data. |
| Release Date: 3/29/2024 |
| Next Release Date: 4/30/2024 |