|
Download Data (XLS File) |
|
||||||||
|
||||||||
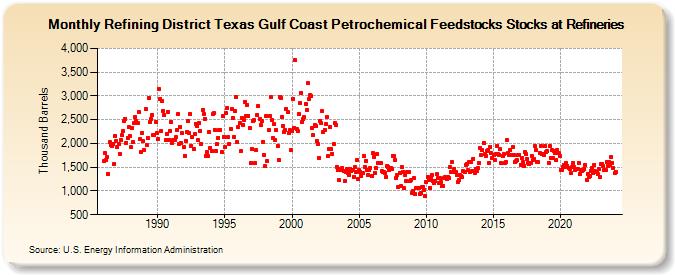
| Refining District Texas Gulf Coast Petrochemical Feedstocks Stocks at Refineries (Thousand Barrels) | ||||||||
| Year | Jan | Feb | Mar | Apr | May | Jun | Jul | Aug | Sep | Oct | Nov | Dec |
|---|---|---|---|---|---|---|---|---|---|---|---|---|
| 1986 | 1,629 | 1,794 | 1,655 | 1,712 | 1,359 | 2,027 | 1,963 | 1,937 | 1,983 | 1,563 | 2,163 | 2,052 |
| 1987 | 1,921 | 1,982 | 1,786 | 2,069 | 2,171 | 2,265 | 2,482 | 2,519 | 2,018 | 2,118 | 2,351 | 2,152 |
| 1988 | 1,915 | 2,332 | 2,029 | 2,439 | 2,561 | 2,472 | 2,427 | 2,671 | 2,084 | 1,821 | 2,222 | 2,045 |
| 1989 | 1,871 | 2,720 | 1,957 | 2,123 | 2,954 | 2,452 | 2,516 | 2,596 | 2,186 | 2,172 | 2,460 | 2,211 |
| 1990 | 2,091 | 3,147 | 2,945 | 2,270 | 2,900 | 2,685 | 2,594 | 2,077 | 2,203 | 2,668 | 2,079 | 2,257 |
| 1991 | 2,451 | 2,007 | 2,065 | 2,063 | 2,130 | 2,282 | 2,612 | 1,995 | 2,353 | 2,000 | 2,218 | 1,923 |
| 1992 | 1,741 | 2,050 | 2,236 | 2,464 | 2,213 | 2,612 | 1,954 | 2,140 | 1,882 | 2,199 | 2,415 | 2,372 |
| 1993 | 2,064 | 2,431 | 2,257 | 1,985 | 2,708 | 2,629 | 2,520 | 1,740 | 1,814 | 1,726 | 2,246 | 1,910 |
| 1994 | 1,847 | 2,610 | 2,630 | 2,289 | 1,845 | 1,980 | 2,119 | 2,284 | 2,285 | 1,818 | 2,569 | 2,144 |
| 1995 | 1,923 | 2,640 | 2,745 | 2,126 | 1,997 | 2,309 | 2,720 | 2,541 | 2,144 | 2,682 | 2,983 | 2,023 |
| 1996 | 2,351 | 2,428 | 1,832 | 2,542 | 2,397 | 2,498 | 2,880 | 2,567 | 2,817 | 2,587 | 2,325 | 1,584 |
| 1997 | 1,889 | 2,468 | 2,484 | 1,584 | 1,852 | 2,599 | 2,787 | 2,522 | 2,387 | 2,464 | 2,036 | 1,766 |
| 1998 | 1,515 | 2,586 | 1,629 | 2,284 | 2,577 | 2,981 | 2,490 | 2,118 | 2,401 | 2,078 | 2,284 | 1,956 |
| 1999 | 1,657 | 2,986 | 2,959 | 2,565 | 2,364 | 2,242 | 2,285 | 2,722 | 2,660 | 2,226 | 2,273 | 1,856 |
| 2000 | 2,266 | 2,935 | 2,325 | 3,746 | 2,301 | 2,254 | 2,617 | 2,855 | 3,071 | 2,458 | 2,523 | 2,550 |
| 2001 | 2,840 | 2,706 | 3,265 | 2,930 | 3,015 | 2,993 | 2,325 | 2,168 | 2,386 | 2,365 | 2,058 | 1,992 |
| 2002 | 1,701 | 2,478 | 2,426 | 2,676 | 2,245 | 2,290 | 2,403 | 2,564 | 1,729 | 1,876 | 2,343 | 1,876 |
| 2003 | 1,787 | 1,978 | 2,429 | 2,385 | 1,513 | 1,435 | 1,229 | 1,452 | 1,441 | 1,484 | 1,429 | 1,205 |
| 2004 | 1,407 | 1,457 | 1,370 | 1,338 | 1,456 | 1,420 | 1,437 | 1,299 | 1,502 | 1,398 | 1,654 | 1,257 |
| 2005 | 1,437 | 1,406 | 1,312 | 1,385 | 1,726 | 1,507 | 1,640 | 1,434 | 1,336 | 1,449 | 1,488 | 1,310 |
| 2006 | 1,789 | 1,720 | 1,384 | 1,492 | 1,776 | 1,597 | 1,579 | 1,582 | 1,413 | 1,394 | 1,401 | 1,384 |
| 2007 | 1,295 | 1,535 | 1,510 | 1,433 | 1,490 | 1,459 | 1,746 | 1,732 | 1,649 | 1,263 | 1,331 | 1,088 |
| 2008 | 1,385 | 1,102 | 1,502 | 1,399 | 1,056 | 1,341 | 1,216 | 1,397 | 1,404 | 1,202 | 1,223 | 966 |
| 2009 | 1,001 | 1,268 | 935 | 1,053 | 1,068 | 1,053 | 940 | 964 | 1,074 | 1,079 | 1,026 | 889 |
| 2010 | 1,181 | 1,298 | 1,223 | 1,060 | 1,282 | 1,336 | 1,214 | 1,173 | 1,207 | 1,352 | 1,277 | 1,166 |
| 2011 | 1,267 | 1,185 | 1,106 | 1,108 | 1,271 | 1,295 | 1,258 | 1,294 | 1,265 | 1,501 | 1,401 | 1,601 |
| 2012 | 1,402 | 1,470 | 1,393 | 1,328 | 1,193 | 1,236 | 1,330 | 1,309 | 1,287 | 1,414 | 1,408 | 1,551 |
| 2013 | 1,574 | 1,432 | 1,604 | 1,396 | 1,618 | 1,421 | 1,679 | 1,381 | 1,466 | 1,426 | 1,483 | 1,598 |
| 2014 | 1,905 | 1,750 | 1,859 | 2,014 | 1,773 | 1,746 | 1,843 | 1,863 | 1,596 | 1,934 | 1,808 | 1,700 |
| 2015 | 1,758 | 1,651 | 1,785 | 1,954 | 1,769 | 1,767 | 1,882 | 1,580 | 1,745 | 1,775 | 1,589 | 1,611 |
| 2016 | 2,068 | 1,802 | 1,748 | 1,852 | 1,755 | 1,928 | 1,758 | 1,604 | 1,625 | 1,643 | 1,749 | 1,763 |
| 2017 | 1,556 | 1,688 | 1,601 | 1,529 | 1,818 | 1,771 | 1,674 | 1,588 | 1,577 | 1,581 | 1,743 | 1,644 |
| 2018 | 1,668 | 1,939 | 1,858 | 1,618 | 1,600 | 1,796 | 1,953 | 1,774 | 1,788 | 1,757 | 1,943 | 1,822 |
| 2019 | 1,831 | 1,594 | 1,938 | 1,703 | 1,854 | 1,695 | 1,838 | 1,798 | 1,641 | 1,868 | 1,789 | 1,746 |
| 2020 | 1,444 | 1,441 | 1,511 | 1,542 | 1,508 | 1,588 | 1,520 | 1,473 | 1,459 | 1,388 | 1,507 | 1,590 |
| 2021 | 1,508 | 1,442 | 1,472 | 1,457 | 1,595 | 1,354 | 1,436 | 1,411 | 1,446 | 1,469 | 1,547 | 1,233 |
| 2022 | 1,360 | 1,291 | 1,316 | 1,427 | 1,489 | 1,387 | 1,553 | 1,414 | 1,408 | 1,354 | 1,457 | 1,295 |
| 2023 | 1,558 | 1,564 | 1,528 | 1,451 | 1,435 | 1,612 | 1,529 | 1,599 | 1,545 | 1,711 | 1,591 | 1,481 |
| 2024 | 1,373 | |||||||||||
| - = No Data Reported; -- = Not Applicable; NA = Not Available; W = Withheld to avoid disclosure of individual company data. |
| Release Date: 3/29/2024 |
| Next Release Date: 4/30/2024 |