|
Download Data (XLS File) |
|
||||||||
|
||||||||
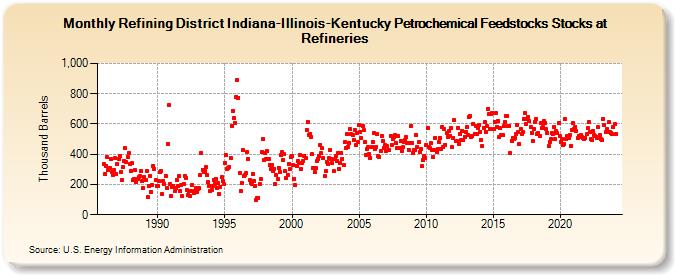
| Refining District Indiana-Illinois-Kentucky Petrochemical Feedstocks Stocks at Refineries (Thousand Barrels) | ||||||||
| Year | Jan | Feb | Mar | Apr | May | Jun | Jul | Aug | Sep | Oct | Nov | Dec |
|---|---|---|---|---|---|---|---|---|---|---|---|---|
| 1986 | 333 | 269 | 325 | 379 | 296 | 310 | 369 | 280 | 265 | 294 | 374 | 270 |
| 1987 | 335 | 367 | 387 | 281 | 231 | 315 | 356 | 441 | 350 | 382 | 409 | 335 |
| 1988 | 291 | 339 | 228 | 238 | 293 | 217 | 238 | 247 | 254 | 288 | 221 | 176 |
| 1989 | 247 | 227 | 287 | 114 | 192 | 257 | 151 | 196 | 325 | 305 | 227 | 193 |
| 1990 | 188 | 220 | 280 | 289 | 140 | 224 | 204 | 255 | 175 | 469 | 725 | 205 |
| 1991 | 127 | 183 | 193 | 154 | 176 | 230 | 193 | 254 | 154 | 196 | 123 | 205 |
| 1992 | 257 | 246 | 162 | 133 | 158 | 125 | 157 | 197 | 146 | 155 | 176 | 152 |
| 1993 | 172 | 174 | 264 | 407 | 296 | 284 | 289 | 313 | 263 | 215 | 192 | 160 |
| 1994 | 166 | 193 | 227 | 200 | 239 | 179 | 207 | 139 | 186 | 247 | 223 | 200 |
| 1995 | 341 | 398 | 303 | 311 | 318 | 377 | 589 | 689 | 641 | 609 | 781 | 892 |
| 1996 | 774 | 278 | 159 | 209 | 429 | 253 | 261 | 273 | 416 | 370 | 227 | 207 |
| 1997 | 200 | 270 | 225 | 192 | 98 | 109 | 112 | 200 | 236 | 417 | 499 | 360 |
| 1998 | 407 | 371 | 419 | 366 | 331 | 299 | 327 | 289 | 305 | 204 | 261 | 233 |
| 1999 | 311 | 285 | 393 | 412 | 365 | 399 | 287 | 243 | 265 | 337 | 300 | 381 |
| 2000 | 388 | 330 | 238 | 194 | 324 | 358 | 340 | 392 | 305 | 345 | 354 | 389 |
| 2001 | 375 | 562 | 615 | 529 | 536 | 517 | 400 | 312 | 282 | 312 | 352 | 369 |
| 2002 | 391 | 463 | 409 | 438 | 376 | 253 | 286 | 351 | 334 | 372 | 430 | 371 |
| 2003 | 341 | 287 | 367 | 386 | 353 | 409 | 305 | 344 | 409 | 371 | 326 | 480 |
| 2004 | 444 | 533 | 451 | 477 | 568 | 532 | 529 | 495 | 558 | 460 | 538 | 478 |
| 2005 | 594 | 550 | 505 | 588 | 558 | 483 | 396 | 434 | 447 | 403 | 378 | 446 |
| 2006 | 483 | 541 | 437 | 450 | 533 | 386 | 382 | 420 | 519 | 488 | 441 | 460 |
| 2007 | 421 | 452 | 431 | 429 | 521 | 461 | 501 | 514 | 525 | 474 | 438 | 519 |
| 2008 | 442 | 486 | 422 | 446 | 480 | 495 | 512 | 471 | 431 | 477 | 586 | 475 |
| 2009 | 411 | 431 | 427 | 524 | 450 | 478 | 417 | 436 | 319 | 359 | 391 | 374 |
| 2010 | 464 | 571 | 451 | 439 | 472 | 431 | 382 | 429 | 508 | 415 | 432 | 481 |
| 2011 | 510 | 432 | 583 | 449 | 570 | 463 | 538 | 515 | 552 | 523 | 576 | 446 |
| 2012 | 509 | 625 | 487 | 488 | 575 | 468 | 537 | 497 | 555 | 491 | 517 | 547 |
| 2013 | 577 | 527 | 643 | 654 | 515 | 523 | 603 | 535 | 587 | 534 | 576 | 596 |
| 2014 | 544 | 494 | 453 | 576 | 612 | 549 | 585 | 701 | 665 | 569 | 666 | 674 |
| 2015 | 566 | 616 | 674 | 583 | 622 | 515 | 574 | 526 | 530 | 584 | 615 | 655 |
| 2016 | 653 | 585 | 587 | 406 | 490 | 509 | 500 | 505 | 537 | 594 | 544 | 467 |
| 2017 | 568 | 535 | 548 | 630 | 673 | 601 | 631 | 648 | 619 | 581 | 542 | 488 |
| 2018 | 568 | 616 | 633 | 536 | 539 | 523 | 608 | 572 | 577 | 620 | 609 | 565 |
| 2019 | 542 | 454 | 482 | 499 | 538 | 534 | 583 | 500 | 556 | 539 | 607 | 520 |
| 2020 | 481 | 501 | 460 | 467 | 631 | 500 | 523 | 509 | 527 | 453 | 561 | 604 |
| 2021 | 568 | 581 | 554 | 506 | 521 | 516 | 529 | 515 | 508 | 499 | 509 | 532 |
| 2022 | 571 | 612 | 546 | 498 | 492 | 556 | 527 | 518 | 510 | 578 | 514 | 528 |
| 2023 | 499 | 496 | 635 | 593 | 545 | 566 | 549 | 610 | 546 | 539 | 532 | 577 |
| 2024 | 598 | |||||||||||
| - = No Data Reported; -- = Not Applicable; NA = Not Available; W = Withheld to avoid disclosure of individual company data. |
| Release Date: 3/29/2024 |
| Next Release Date: 4/30/2024 |