|
Download Data (XLS File) |
|
||||||||
|
||||||||
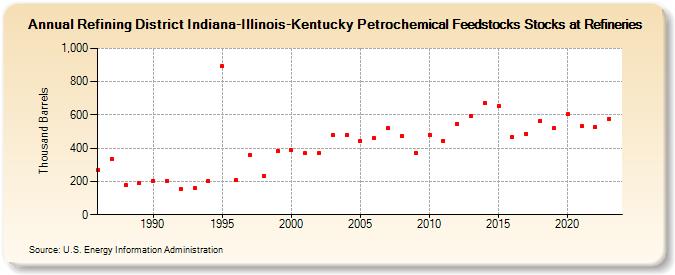
| Refining District Indiana-Illinois-Kentucky Petrochemical Feedstocks Stocks at Refineries (Thousand Barrels) | ||||||||
| Decade | Year-0 | Year-1 | Year-2 | Year-3 | Year-4 | Year-5 | Year-6 | Year-7 | Year-8 | Year-9 |
|---|---|---|---|---|---|---|---|---|---|---|
| 1980's | 270 | 335 | 176 | 193 | ||||||
| 1990's | 205 | 205 | 152 | 160 | 200 | 892 | 207 | 360 | 233 | 381 |
| 2000's | 389 | 369 | 371 | 480 | 478 | 446 | 460 | 519 | 475 | 374 |
| 2010's | 481 | 446 | 547 | 596 | 674 | 655 | 467 | 488 | 565 | 520 |
| 2020's | 604 | 532 | 528 | 577 |
| - = No Data Reported; -- = Not Applicable; NA = Not Available; W = Withheld to avoid disclosure of individual company data. |
| Release Date: 8/30/2024 |
| Next Release Date: 8/29/2025 |