|
Download Data (XLS File) |
|
||||||||
|
||||||||
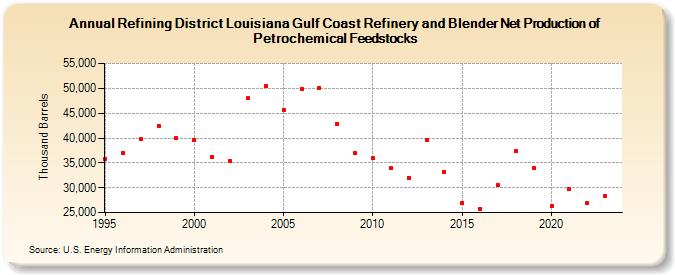
| Refining District Louisiana Gulf Coast Refinery and Blender Net Production of Petrochemical Feedstocks (Thousand Barrels) | ||||||||
| Decade | Year-0 | Year-1 | Year-2 | Year-3 | Year-4 | Year-5 | Year-6 | Year-7 | Year-8 | Year-9 |
|---|---|---|---|---|---|---|---|---|---|---|
| 1990's | 35,766 | 36,901 | 39,814 | 42,489 | 40,053 | |||||
| 2000's | 39,547 | 36,192 | 35,304 | 47,970 | 50,482 | 45,646 | 49,927 | 50,050 | 42,881 | 36,946 |
| 2010's | 35,916 | 33,943 | 31,972 | 39,651 | 33,090 | 26,963 | 25,687 | 30,528 | 37,352 | 34,052 |
| 2020's | 26,367 | 29,794 | 26,836 | 28,269 |
| - = No Data Reported; -- = Not Applicable; NA = Not Available; W = Withheld to avoid disclosure of individual company data. |
| Release Date: 3/29/2024 |
| Next Release Date: 8/30/2024 |