|
Download Data (XLS File) |
|
||||||||
|
||||||||
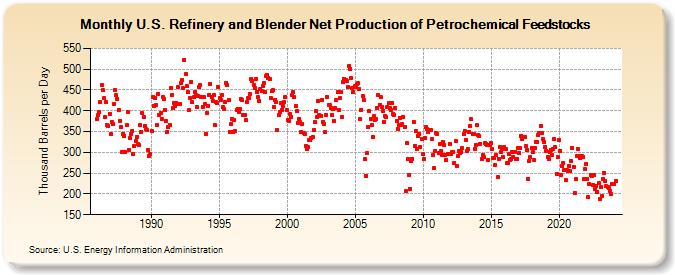
| U.S. Refinery and Blender Net Production of Petrochemical Feedstocks (Thousand Barrels per Day) | ||||||||
| Year | Jan | Feb | Mar | Apr | May | Jun | Jul | Aug | Sep | Oct | Nov | Dec |
|---|---|---|---|---|---|---|---|---|---|---|---|---|
| 1986 | 379 | 391 | 397 | 420 | 461 | 449 | 430 | 384 | 420 | 365 | 363 | 393 |
| 1987 | 343 | 373 | 367 | 417 | 451 | 437 | 429 | 402 | 376 | 360 | 301 | 345 |
| 1988 | 339 | 301 | 366 | 396 | 306 | 335 | 343 | 352 | 296 | 315 | 327 | 338 |
| 1989 | 320 | 317 | 366 | 350 | 394 | 384 | 364 | 355 | 354 | 306 | 292 | 295 |
| 1990 | 352 | 433 | 412 | 431 | 413 | 365 | 441 | 390 | 395 | 380 | 432 | 428 |
| 1991 | 403 | 375 | 350 | 361 | 366 | 454 | 438 | 407 | 419 | 411 | 419 | 457 |
| 1992 | 416 | 416 | 467 | 475 | 454 | 523 | 488 | 459 | 445 | 401 | 431 | 470 |
| 1993 | 420 | 432 | 444 | 437 | 410 | 435 | 456 | 461 | 432 | 410 | 432 | 416 |
| 1994 | 345 | 395 | 412 | 439 | 465 | 433 | 424 | 438 | 365 | 421 | 419 | 457 |
| 1995 | 430 | 425 | 437 | 408 | 404 | 421 | 467 | 461 | 426 | 350 | 368 | 380 |
| 1996 | 350 | 378 | 351 | 403 | 405 | 396 | 404 | 429 | 426 | 389 | 390 | 378 |
| 1997 | 420 | 430 | 430 | 440 | 477 | 472 | 462 | 454 | 477 | 446 | 432 | 423 |
| 1998 | 452 | 448 | 459 | 466 | 444 | 484 | 487 | 479 | 476 | 431 | 448 | 449 |
| 1999 | 410 | 426 | 421 | 353 | 391 | 398 | 418 | 402 | 411 | 420 | 433 | 403 |
| 2000 | 377 | 375 | 393 | 386 | 438 | 444 | 432 | 412 | 399 | 371 | 381 | 372 |
| 2001 | 348 | 368 | 346 | 345 | 316 | 308 | 312 | 329 | 330 | 334 | 337 | 353 |
| 2002 | 372 | 400 | 385 | 423 | 391 | 388 | 426 | 374 | 369 | 348 | 391 | 433 |
| 2003 | 414 | 413 | 407 | 390 | 404 | 376 | 406 | 426 | 444 | 403 | 430 | 445 |
| 2004 | 385 | 468 | 476 | 474 | 471 | 456 | 508 | 501 | 479 | 455 | 445 | 459 |
| 2005 | 458 | 464 | 466 | 453 | 379 | 403 | 435 | 426 | 283 | 244 | 299 | 361 |
| 2006 | 399 | 381 | 365 | 337 | 387 | 378 | 379 | 406 | 439 | 415 | 432 | 410 |
| 2007 | 399 | 374 | 387 | 384 | 409 | 418 | 406 | 402 | 418 | 393 | 390 | 407 |
| 2008 | 375 | 356 | 366 | 383 | 365 | 367 | 386 | 362 | 206 | 322 | 283 | 245 |
| 2009 | 213 | 279 | 285 | 373 | 316 | 352 | 309 | 339 | 345 | 313 | 333 | 295 |
| 2010 | 283 | 335 | 360 | 356 | 348 | 353 | 354 | 332 | 293 | 262 | 304 | 346 |
| 2011 | 344 | 298 | 319 | 303 | 294 | 326 | 318 | 293 | 282 | 295 | 295 | 321 |
| 2012 | 296 | 302 | 301 | 274 | 327 | 268 | 291 | 304 | 299 | 301 | 310 | 343 |
| 2013 | 351 | 330 | 304 | 308 | 349 | 363 | 379 | 345 | 343 | 307 | 318 | 365 |
| 2014 | 342 | 339 | 321 | 283 | 294 | 288 | 323 | 321 | 317 | 281 | 318 | 323 |
| 2015 | 308 | 286 | 287 | 269 | 293 | 240 | 285 | 314 | 300 | 309 | 288 | 313 |
| 2016 | 308 | 274 | 275 | 296 | 282 | 284 | 301 | 289 | 301 | 285 | 285 | 311 |
| 2017 | 298 | 310 | 340 | 331 | 336 | 338 | 315 | 306 | 235 | 280 | 288 | 310 |
| 2018 | 300 | 281 | 310 | 324 | 324 | 341 | 347 | 364 | 346 | 331 | 325 | 314 |
| 2019 | 304 | 288 | 283 | 301 | 305 | 293 | 308 | 332 | 312 | 248 | 289 | 330 |
| 2020 | 304 | 246 | 266 | 275 | 257 | 233 | 257 | 255 | 266 | 256 | 278 | 310 |
| 2021 | 264 | 203 | 235 | 292 | 308 | 292 | 286 | 291 | 290 | 236 | 260 | 272 |
| 2022 | 236 | 192 | 223 | 245 | 244 | 222 | 246 | 213 | 218 | 205 | 226 | 188 |
| 2023 | 216 | 195 | 236 | 251 | 231 | 218 | 217 | 214 | 208 | 201 | 224 | 223 |
| 2024 | 224 | |||||||||||
| - = No Data Reported; -- = Not Applicable; NA = Not Available; W = Withheld to avoid disclosure of individual company data. |
| Release Date: 3/29/2024 |
| Next Release Date: 4/30/2024 |