|
Download Data (XLS File) |
|
||||||||
|
||||||||
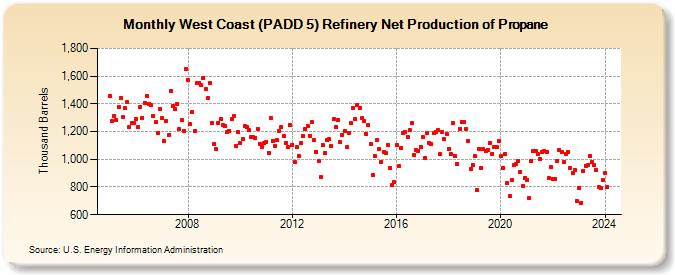
| West Coast (PADD 5) Refinery Net Production of Propane (Thousand Barrels) | ||||||||
| Year | Jan | Feb | Mar | Apr | May | Jun | Jul | Aug | Sep | Oct | Nov | Dec |
|---|---|---|---|---|---|---|---|---|---|---|---|---|
| 2005 | 1,456 | 1,275 | 1,313 | 1,283 | 1,374 | 1,442 | 1,306 | 1,367 | 1,411 | 1,233 | 1,260 | 1,265 |
| 2006 | 1,291 | 1,233 | 1,378 | 1,301 | 1,408 | 1,459 | 1,402 | 1,392 | 1,310 | 1,272 | 1,193 | 1,362 |
| 2007 | 1,300 | 1,133 | 1,276 | 1,173 | 1,494 | 1,387 | 1,365 | 1,400 | 1,218 | 1,286 | 1,206 | 1,650 |
| 2008 | 1,570 | 1,251 | 1,343 | 1,204 | 1,551 | 1,550 | 1,534 | 1,589 | 1,504 | 1,441 | 1,550 | 1,265 |
| 2009 | 1,113 | 1,074 | 1,265 | 1,290 | 1,245 | 1,238 | 1,195 | 1,204 | 1,287 | 1,312 | 1,096 | 1,195 |
| 2010 | 1,116 | 1,145 | 1,241 | 1,230 | 1,212 | 1,160 | 1,162 | 1,152 | 1,217 | 1,113 | 1,092 | 1,116 |
| 2011 | 1,128 | 1,048 | 1,299 | 1,134 | 1,095 | 1,137 | 1,202 | 1,231 | 1,169 | 1,120 | 1,086 | 1,247 |
| 2012 | 1,105 | 980 | 1,089 | 1,025 | 1,119 | 1,171 | 1,218 | 1,241 | 1,170 | 1,266 | 1,140 | 1,055 |
| 2013 | 984 | 871 | 1,100 | 1,044 | 1,137 | 1,143 | 1,097 | 1,288 | 1,230 | 1,281 | 1,123 | 1,177 |
| 2014 | 1,206 | 1,086 | 1,190 | 1,264 | 1,371 | 1,291 | 1,393 | 1,372 | 1,296 | 1,276 | 1,184 | 1,249 |
| 2015 | 1,108 | 883 | 1,027 | 1,139 | 1,074 | 983 | 1,052 | 1,047 | 1,104 | 940 | 811 | 833 |
| 2016 | 1,102 | 949 | 1,084 | 1,190 | 1,198 | 1,159 | 1,209 | 1,262 | 1,034 | 1,067 | 1,063 | 1,092 |
| 2017 | 1,161 | 1,006 | 1,190 | 1,118 | 1,109 | 1,190 | 1,199 | 1,211 | 1,035 | 1,200 | 1,147 | 1,182 |
| 2018 | 1,076 | 1,035 | 1,264 | 1,021 | 968 | 1,217 | 1,268 | 1,271 | 1,218 | 1,133 | 929 | 961 |
| 2019 | 1,021 | 777 | 1,073 | 940 | 1,071 | 1,059 | 1,069 | 1,119 | 1,039 | 1,085 | 1,087 | 1,134 |
| 2020 | 1,021 | 939 | 1,037 | 826 | 737 | 850 | 957 | 964 | 989 | 907 | 806 | 868 |
| 2021 | 852 | 722 | 990 | 1,061 | 1,058 | 1,039 | 1,002 | 1,050 | 1,061 | 1,049 | 862 | 946 |
| 2022 | 859 | 856 | 988 | 1,066 | 1,053 | 980 | 1,040 | 1,049 | 938 | 901 | 922 | 697 |
| 2023 | 791 | 687 | 919 | 955 | 957 | 1,026 | 977 | 960 | 924 | 801 | 792 | 853 |
| 2024 | 900 | |||||||||||
| - = No Data Reported; -- = Not Applicable; NA = Not Available; W = Withheld to avoid disclosure of individual company data. |
| Release Date: 3/29/2024 |
| Next Release Date: 4/30/2024 |
Referring Pages: