|
Download Data (XLS File) |
|
||||||||
|
||||||||
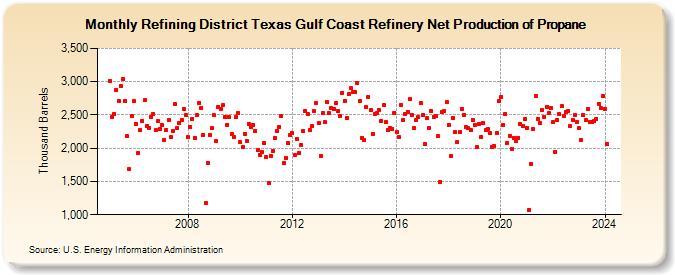
| Refining District Texas Gulf Coast Refinery Net Production of Propane (Thousand Barrels) | ||||||||
| Year | Jan | Feb | Mar | Apr | May | Jun | Jul | Aug | Sep | Oct | Nov | Dec |
|---|---|---|---|---|---|---|---|---|---|---|---|---|
| 2005 | 3,015 | 2,469 | 2,519 | 2,882 | 2,710 | 2,937 | 3,042 | 2,709 | 2,178 | 1,682 | 2,486 | 2,705 |
| 2006 | 2,369 | 1,922 | 2,267 | 2,413 | 2,718 | 2,332 | 2,303 | 2,474 | 2,514 | 2,271 | 2,406 | 2,290 |
| 2007 | 2,354 | 2,117 | 2,280 | 2,426 | 2,167 | 2,259 | 2,660 | 2,297 | 2,378 | 2,431 | 2,590 | 2,499 |
| 2008 | 2,166 | 2,316 | 2,444 | 2,157 | 2,506 | 2,686 | 2,608 | 2,198 | 1,180 | 1,772 | 2,200 | 2,297 |
| 2009 | 2,493 | 2,109 | 2,623 | 2,594 | 2,648 | 2,469 | 2,354 | 2,466 | 2,212 | 2,162 | 2,472 | 2,531 |
| 2010 | 2,088 | 2,017 | 2,214 | 2,108 | 2,364 | 2,318 | 2,351 | 2,257 | 1,976 | 1,903 | 1,943 | 2,071 |
| 2011 | 1,862 | 1,471 | 1,882 | 1,959 | 2,157 | 2,254 | 2,324 | 2,477 | 1,775 | 1,853 | 2,071 | 2,195 |
| 2012 | 2,228 | 1,898 | 2,144 | 1,925 | 2,054 | 2,257 | 2,557 | 2,517 | 2,275 | 2,329 | 2,557 | 2,681 |
| 2013 | 2,375 | 1,885 | 2,528 | 2,390 | 2,691 | 2,524 | 2,597 | 2,590 | 2,677 | 2,555 | 2,487 | 2,831 |
| 2014 | 2,709 | 2,449 | 2,820 | 2,899 | 2,841 | 2,840 | 2,981 | 2,703 | 2,158 | 2,117 | 2,617 | 2,772 |
| 2015 | 2,571 | 2,211 | 2,513 | 2,530 | 2,569 | 2,413 | 2,642 | 2,389 | 2,280 | 2,309 | 2,291 | 2,529 |
| 2016 | 2,241 | 2,167 | 2,651 | 2,421 | 2,509 | 2,548 | 2,732 | 2,501 | 2,302 | 2,424 | 2,462 | 2,674 |
| 2017 | 2,506 | 2,063 | 2,447 | 2,299 | 2,560 | 2,476 | 2,481 | 2,178 | 1,493 | 2,551 | 2,556 | 2,687 |
| 2018 | 2,355 | 1,883 | 2,461 | 2,240 | 2,089 | 2,239 | 2,593 | 2,506 | 2,320 | 2,296 | 2,267 | 2,430 |
| 2019 | 2,353 | 2,017 | 2,365 | 2,175 | 2,373 | 2,268 | 2,288 | 2,223 | 2,016 | 2,035 | 2,227 | 2,703 |
| 2020 | 2,771 | 2,355 | 2,515 | 2,085 | 2,190 | 1,995 | 2,157 | 2,106 | 2,159 | 2,362 | 2,329 | 2,435 |
| 2021 | 2,308 | 1,073 | 1,767 | 2,290 | 2,777 | 2,441 | 2,381 | 2,575 | 2,472 | 2,612 | 2,522 | 2,607 |
| 2022 | 2,388 | 1,950 | 2,422 | 2,516 | 2,627 | 2,482 | 2,544 | 2,554 | 2,326 | 2,431 | 2,500 | 2,396 |
| 2023 | 2,296 | 2,125 | 2,498 | 2,417 | 2,585 | 2,397 | 2,390 | 2,409 | 2,438 | 2,670 | 2,605 | 2,781 |
| 2024 | 2,590 | |||||||||||
| - = No Data Reported; -- = Not Applicable; NA = Not Available; W = Withheld to avoid disclosure of individual company data. |
| Release Date: 3/29/2024 |
| Next Release Date: 4/30/2024 |