|
Download Data (XLS File) |
|
||||||||
|
||||||||
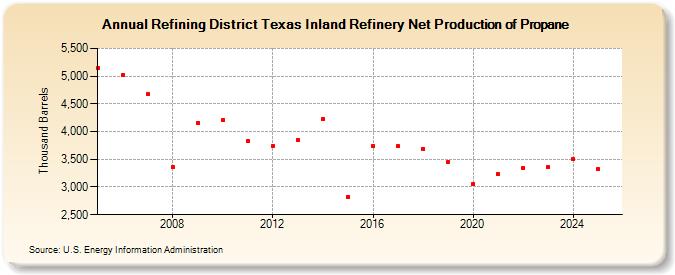
| Refining District Texas Inland Refinery Net Production of Propane (Thousand Barrels) | ||||||||
| Decade | Year-0 | Year-1 | Year-2 | Year-3 | Year-4 | Year-5 | Year-6 | Year-7 | Year-8 | Year-9 |
|---|---|---|---|---|---|---|---|---|---|---|
| 2000's | 5,140 | 5,027 | 4,670 | 3,359 | 4,163 | |||||
| 2010's | 4,213 | 3,834 | 3,740 | 3,856 | 4,233 | 2,825 | 3,740 | 3,733 | 3,687 | 3,455 |
| 2020's | 3,057 | 3,231 | 3,349 | 3,353 |
| - = No Data Reported; -- = Not Applicable; NA = Not Available; W = Withheld to avoid disclosure of individual company data. |
| Release Date: 3/29/2024 |
| Next Release Date: 8/30/2024 |
Referring Pages: