|
Download Data (XLS File) |
|
||||||||
|
||||||||
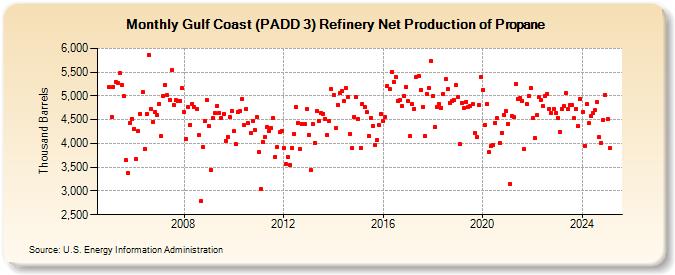
| Gulf Coast (PADD 3) Refinery Net Production of Propane (Thousand Barrels) | ||||||||
| Year | Jan | Feb | Mar | Apr | May | Jun | Jul | Aug | Sep | Oct | Nov | Dec |
|---|---|---|---|---|---|---|---|---|---|---|---|---|
| 2005 | 5,180 | 4,559 | 5,196 | 5,302 | 5,273 | 5,474 | 5,234 | 4,990 | 3,642 | 3,384 | 4,438 | 4,515 |
| 2006 | 4,313 | 3,663 | 4,253 | 4,623 | 5,072 | 3,883 | 4,627 | 5,861 | 4,717 | 4,453 | 4,670 | 4,590 |
| 2007 | 4,840 | 4,150 | 5,008 | 5,236 | 5,011 | 4,920 | 5,538 | 4,816 | 4,905 | 4,891 | 4,886 | 5,157 |
| 2008 | 4,656 | 4,097 | 4,762 | 4,397 | 4,838 | 4,757 | 4,733 | 4,178 | 2,788 | 3,925 | 4,468 | 4,905 |
| 2009 | 4,361 | 3,446 | 4,531 | 4,632 | 4,793 | 4,647 | 4,527 | 4,616 | 4,060 | 4,145 | 4,549 | 4,683 |
| 2010 | 4,255 | 3,979 | 4,653 | 4,677 | 4,939 | 4,379 | 4,722 | 4,422 | 4,221 | 4,482 | 4,292 | 4,551 |
| 2011 | 3,810 | 3,036 | 4,025 | 4,137 | 4,339 | 4,271 | 4,329 | 4,536 | 3,719 | 3,918 | 4,234 | 4,267 |
| 2012 | 3,899 | 3,564 | 3,724 | 3,549 | 3,905 | 4,204 | 4,761 | 4,438 | 3,876 | 4,400 | 4,414 | 4,717 |
| 2013 | 4,187 | 3,433 | 4,410 | 4,015 | 4,691 | 4,480 | 4,648 | 4,625 | 4,510 | 4,179 | 4,471 | 5,140 |
| 2014 | 5,023 | 4,316 | 4,811 | 5,053 | 5,101 | 4,886 | 5,176 | 4,980 | 4,204 | 3,895 | 4,563 | 4,975 |
| 2015 | 4,510 | 3,905 | 4,832 | 4,759 | 4,654 | 4,162 | 4,539 | 4,369 | 3,967 | 4,076 | 4,386 | 4,627 |
| 2016 | 4,468 | 4,551 | 5,206 | 5,139 | 5,512 | 5,300 | 5,399 | 4,901 | 4,921 | 4,785 | 5,005 | 5,192 |
| 2017 | 4,886 | 4,146 | 4,826 | 4,735 | 5,400 | 5,424 | 5,132 | 4,773 | 4,152 | 5,040 | 5,174 | 5,727 |
| 2018 | 5,003 | 4,342 | 4,770 | 4,827 | 4,754 | 5,045 | 5,348 | 5,138 | 4,856 | 4,887 | 4,923 | 5,223 |
| 2019 | 4,970 | 3,978 | 4,860 | 4,747 | 4,881 | 4,775 | 4,790 | 4,835 | 4,229 | 4,141 | 4,811 | 5,405 |
| 2020 | 5,134 | 4,397 | 4,830 | 3,814 | 3,945 | 3,957 | 4,439 | 4,529 | 4,005 | 4,228 | 4,607 | 4,681 |
| 2021 | 4,419 | 3,152 | 4,572 | 4,549 | 5,250 | 4,928 | 4,952 | 4,893 | 3,876 | 4,830 | 4,997 | 5,170 |
| 2022 | 4,534 | 4,113 | 4,593 | 4,974 | 4,913 | 4,785 | 4,997 | 5,042 | 4,734 | 4,637 | 4,722 | 4,632 |
| 2023 | 4,540 | 4,243 | 4,733 | 4,779 | 5,055 | 4,725 | 4,817 | 4,815 | 4,526 | 4,829 | 4,369 | 4,943 |
| 2024 | 4,651 | |||||||||||
| - = No Data Reported; -- = Not Applicable; NA = Not Available; W = Withheld to avoid disclosure of individual company data. |
| Release Date: 3/29/2024 |
| Next Release Date: 4/30/2024 |
Referring Pages: