|
Download Data (XLS File) |
|
||||||||
|
||||||||
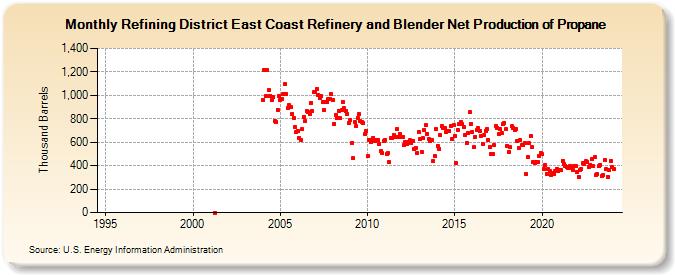
| Refining District East Coast Refinery and Blender Net Production of Propane (Thousand Barrels) | ||||||||
| Year | Jan | Feb | Mar | Apr | May | Jun | Jul | Aug | Sep | Oct | Nov | Dec |
|---|---|---|---|---|---|---|---|---|---|---|---|---|
| 1995 | W | W | W | W | W | W | W | W | W | W | W | W |
| 1996 | W | W | W | W | W | W | W | W | W | W | W | W |
| 1997 | W | W | W | W | W | W | W | W | W | W | W | W |
| 1998 | W | W | W | W | W | W | W | W | W | W | W | W |
| 1999 | W | W | W | W | W | W | W | W | W | W | W | W |
| 2000 | W | W | W | W | W | W | W | W | W | W | W | W |
| 2001 | W | W | W | 0 | W | W | W | W | W | W | W | W |
| 2002 | W | W | W | W | W | W | W | W | W | W | W | W |
| 2003 | W | W | W | W | W | W | W | W | W | W | W | W |
| 2004 | 961 | 1,216 | 993 | 1,215 | 1,045 | 997 | 956 | 982 | 779 | 775 | 878 | 994 |
| 2005 | 963 | 967 | 1,008 | 1,098 | 1,012 | 890 | 913 | 896 | 842 | 808 | 729 | 687 |
| 2006 | 696 | 635 | 619 | 710 | 814 | 777 | 866 | 861 | 842 | 937 | 866 | 1,026 |
| 2007 | 1,025 | 1,057 | 1,004 | 979 | 992 | 939 | 874 | 940 | 946 | 972 | 967 | 1,008 |
| 2008 | 961 | 759 | 834 | 804 | 869 | 805 | 873 | 943 | 889 | 862 | 842 | 765 |
| 2009 | 786 | 592 | 462 | 774 | 736 | 806 | 842 | 778 | 774 | 765 | 672 | 695 |
| 2010 | 479 | 621 | 602 | 621 | 640 | 606 | 619 | 620 | 586 | 525 | 506 | 607 |
| 2011 | 621 | 500 | 509 | 428 | 637 | 637 | 661 | 642 | 712 | 642 | 670 | 647 |
| 2012 | 641 | 573 | 603 | 587 | 601 | 618 | 595 | 608 | 540 | 548 | 509 | 685 |
| 2013 | 625 | 520 | 632 | 705 | 744 | 671 | 626 | 613 | 619 | 440 | 483 | 712 |
| 2014 | 569 | 546 | 659 | 734 | 720 | 722 | 690 | 694 | 695 | 737 | 631 | 743 |
| 2015 | 657 | 420 | 706 | 753 | 771 | 754 | 731 | 658 | 596 | 682 | 855 | 758 |
| 2016 | 687 | 555 | 646 | 700 | 717 | 694 | 657 | 585 | 658 | 699 | 711 | 618 |
| 2017 | 556 | 496 | 503 | 573 | 740 | 724 | 666 | 710 | 676 | 751 | 766 | 709 |
| 2018 | 571 | 520 | 556 | 736 | 725 | 708 | 709 | 609 | 552 | 615 | 580 | 577 |
| 2019 | 592 | 329 | 470 | 589 | 657 | 557 | 430 | 426 | 428 | 434 | 480 | 507 |
| 2020 | 497 | 368 | 402 | 329 | 370 | 354 | 319 | 336 | 326 | 353 | 374 | 353 |
| 2021 | 365 | 359 | 443 | 412 | 400 | 386 | 377 | 393 | 381 | 359 | 397 | 395 |
| 2022 | 347 | 307 | 364 | 373 | 421 | 415 | 437 | 432 | 390 | 408 | 454 | 394 |
| 2023 | 475 | 322 | 330 | 394 | 409 | 311 | 318 | 448 | 369 | 306 | 363 | 440 |
| 2024 | 387 | |||||||||||
| - = No Data Reported; -- = Not Applicable; NA = Not Available; W = Withheld to avoid disclosure of individual company data. |
| Release Date: 3/29/2024 |
| Next Release Date: 4/30/2024 |