|
Download Data (XLS File) |
|
||||||||
|
||||||||
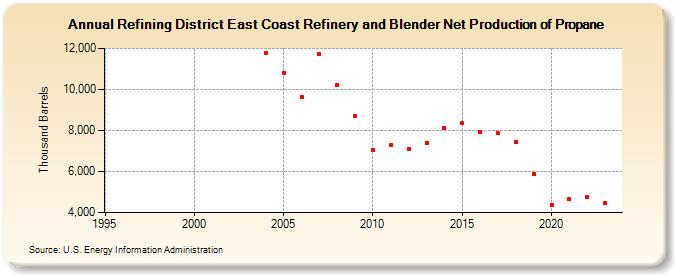
| Refining District East Coast Refinery and Blender Net Production of Propane (Thousand Barrels) | ||||||||
| Decade | Year-0 | Year-1 | Year-2 | Year-3 | Year-4 | Year-5 | Year-6 | Year-7 | Year-8 | Year-9 |
|---|---|---|---|---|---|---|---|---|---|---|
| 1990's | W | W | W | W | W | |||||
| 2000's | W | W | W | W | 11,791 | 10,813 | 9,649 | 11,703 | 10,206 | 8,682 |
| 2010's | 7,032 | 7,306 | 7,108 | 7,390 | 8,140 | 8,341 | 7,927 | 7,870 | 7,458 | 5,899 |
| 2020's | 4,381 | 4,667 | 4,742 | 4,485 |
| - = No Data Reported; -- = Not Applicable; NA = Not Available; W = Withheld to avoid disclosure of individual company data. |
| Release Date: 3/29/2024 |
| Next Release Date: 8/30/2024 |