|
Download Data (XLS File) |
|
||||||||
|
||||||||
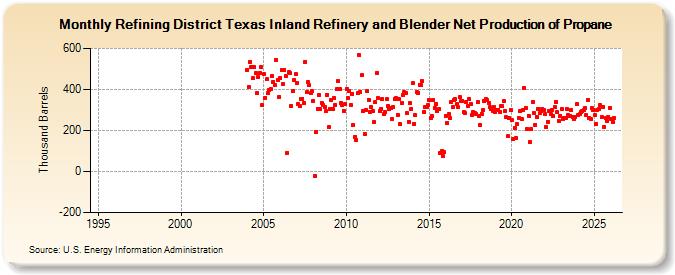
| Refining District Texas Inland Refinery and Blender Net Production of Propane (Thousand Barrels) | ||||||||
| Year | Jan | Feb | Mar | Apr | May | Jun | Jul | Aug | Sep | Oct | Nov | Dec |
|---|---|---|---|---|---|---|---|---|---|---|---|---|
| 1995 | W | W | W | W | W | W | W | W | W | W | W | W |
| 1996 | W | W | W | W | W | W | W | W | W | W | W | W |
| 1997 | W | W | W | W | W | W | W | W | W | W | W | W |
| 1998 | W | W | W | W | W | W | W | W | W | W | W | W |
| 1999 | W | W | W | W | W | W | W | W | W | W | W | W |
| 2000 | W | W | W | W | W | W | W | W | W | W | W | W |
| 2001 | W | W | W | W | W | W | W | W | W | W | W | W |
| 2002 | W | W | W | W | W | W | W | W | W | W | W | W |
| 2003 | W | W | W | W | W | W | W | W | W | W | W | W |
| 2004 | 497 | 412 | 536 | 510 | 454 | 510 | 480 | 382 | 460 | 482 | 509 | 325 |
| 2005 | 474 | 359 | 449 | 381 | 398 | 403 | 465 | 438 | 422 | 541 | 448 | 362 |
| 2006 | 455 | 496 | 425 | 497 | 465 | 92 | 483 | 482 | 321 | 392 | 446 | 473 |
| 2007 | 433 | 329 | 317 | 353 | 355 | 334 | 536 | 386 | 436 | 420 | 381 | 390 |
| 2008 | 346 | -22 | 192 | 306 | 372 | 305 | 336 | 326 | 314 | 293 | 375 | 216 |
| 2009 | 304 | 348 | 303 | 358 | 324 | 402 | 442 | 400 | 333 | 326 | 296 | 327 |
| 2010 | 403 | 358 | 392 | 326 | 379 | 225 | 169 | 155 | 382 | 566 | 389 | 469 |
| 2011 | 294 | 183 | 302 | 390 | 350 | 292 | 312 | 293 | 242 | 338 | 481 | 357 |
| 2012 | 295 | 307 | 353 | 280 | 289 | 353 | 319 | 307 | 311 | 258 | 314 | 354 |
| 2013 | 357 | 277 | 351 | 230 | 334 | 372 | 387 | 384 | 283 | 243 | 332 | 306 |
| 2014 | 430 | 233 | 274 | 387 | 383 | 424 | 420 | 441 | 291 | 315 | 313 | 322 |
| 2015 | 349 | 263 | 269 | 347 | 311 | 330 | 296 | 303 | 91 | 98 | 75 | 93 |
| 2016 | 271 | 237 | 279 | 259 | 339 | 312 | 350 | 351 | 327 | 312 | 361 | 342 |
| 2017 | 345 | 289 | 285 | 341 | 320 | 351 | 331 | 277 | 292 | 285 | 280 | 337 |
| 2018 | 272 | 229 | 282 | 302 | 342 | 351 | 347 | 334 | 313 | 304 | 297 | 314 |
| 2019 | 288 | 301 | 301 | 292 | 318 | 319 | 342 | 296 | 264 | 171 | 263 | 300 |
| 2020 | 249 | 159 | 214 | 164 | 231 | 261 | 293 | 258 | 302 | 408 | 310 | 208 |
| 2021 | 272 | 143 | 207 | 337 | 285 | 229 | 267 | 306 | 284 | 294 | 305 | 302 |
| 2022 | 280 | 217 | 243 | 296 | 279 | 302 | 270 | 313 | 341 | 288 | 248 | 272 |
| 2023 | 306 | 257 | 263 | 261 | 304 | 276 | 272 | 299 | 265 | 258 | 265 | 327 |
| 2024 | 277 | |||||||||||
| - = No Data Reported; -- = Not Applicable; NA = Not Available; W = Withheld to avoid disclosure of individual company data. |
| Release Date: 3/29/2024 |
| Next Release Date: 4/30/2024 |