|
Download Data (XLS File) |
|
||||||||
|
||||||||
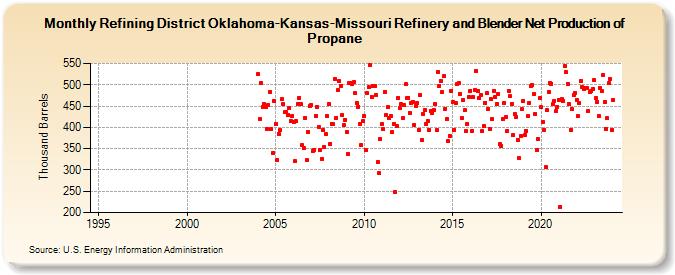
| Refining District Oklahoma-Kansas-Missouri Refinery and Blender Net Production of Propane (Thousand Barrels) | ||||||||
| Year | Jan | Feb | Mar | Apr | May | Jun | Jul | Aug | Sep | Oct | Nov | Dec |
|---|---|---|---|---|---|---|---|---|---|---|---|---|
| 1995 | W | W | W | W | W | W | W | W | W | W | W | W |
| 1996 | W | W | W | W | W | W | W | W | W | W | W | W |
| 1997 | W | W | W | W | W | W | W | W | W | W | W | W |
| 1998 | W | W | W | W | W | W | W | W | W | W | W | W |
| 1999 | W | W | W | W | W | W | W | W | W | W | W | W |
| 2000 | W | W | W | W | W | W | W | W | W | W | W | W |
| 2001 | W | W | W | W | W | W | W | W | W | W | W | W |
| 2002 | W | W | W | W | W | W | W | W | W | W | W | W |
| 2003 | W | W | W | W | W | W | W | W | W | W | W | W |
| 2004 | 525 | 419 | 505 | 448 | 456 | 449 | 397 | 453 | 484 | 396 | 341 | 463 |
| 2005 | 407 | 323 | 385 | 393 | 466 | 454 | 435 | 436 | 428 | 445 | 414 | 427 |
| 2006 | 413 | 320 | 414 | 455 | 470 | 454 | 358 | 351 | 423 | 323 | 390 | 451 |
| 2007 | 453 | 345 | 347 | 427 | 449 | 401 | 348 | 326 | 395 | 354 | 384 | 426 |
| 2008 | 455 | 362 | 409 | 407 | 514 | 422 | 487 | 508 | 498 | 428 | 406 | 418 |
| 2009 | 389 | 338 | 504 | 505 | 503 | 507 | 480 | 458 | 449 | 409 | 359 | 414 |
| 2010 | 427 | 346 | 480 | 494 | 547 | 472 | 496 | 496 | 476 | 319 | 292 | 373 |
| 2011 | 408 | 396 | 484 | 429 | 448 | 423 | 427 | 388 | 408 | 248 | 404 | 469 |
| 2012 | 445 | 454 | 421 | 453 | 501 | 468 | 470 | 434 | 457 | 459 | 406 | 451 |
| 2013 | 457 | 394 | 476 | 370 | 431 | 441 | 408 | 416 | 395 | 438 | 433 | 441 |
| 2014 | 456 | 393 | 531 | 498 | 510 | 482 | 520 | 444 | 419 | 368 | 380 | 486 |
| 2015 | 459 | 394 | 458 | 502 | 504 | 478 | 422 | 465 | 440 | 392 | 409 | 472 |
| 2016 | 486 | 392 | 471 | 488 | 532 | 486 | 470 | 476 | 391 | 403 | 458 | 480 |
| 2017 | 444 | 397 | 466 | 419 | 486 | 471 | 456 | 478 | 360 | 357 | 420 | 458 |
| 2018 | 424 | 391 | 486 | 473 | 456 | 382 | 431 | 425 | 371 | 328 | 380 | 443 |
| 2019 | 463 | 383 | 392 | 426 | 458 | 497 | 499 | 479 | 432 | 346 | 373 | 468 |
| 2020 | 447 | 413 | 395 | 306 | 441 | 484 | 505 | 503 | 454 | 462 | 438 | 449 |
| 2021 | 465 | 214 | 466 | 462 | 543 | 529 | 503 | 454 | 394 | 443 | 475 | 481 |
| 2022 | 465 | 426 | 457 | 509 | 495 | 491 | 492 | 492 | 438 | 482 | 485 | 490 |
| 2023 | 511 | 468 | 460 | 426 | 493 | 486 | 523 | 460 | 396 | 421 | 504 | 513 |
| 2024 | 395 | |||||||||||
| - = No Data Reported; -- = Not Applicable; NA = Not Available; W = Withheld to avoid disclosure of individual company data. |
| Release Date: 3/29/2024 |
| Next Release Date: 4/30/2024 |