|
Download Data (XLS File) |
|
||||||||
|
||||||||
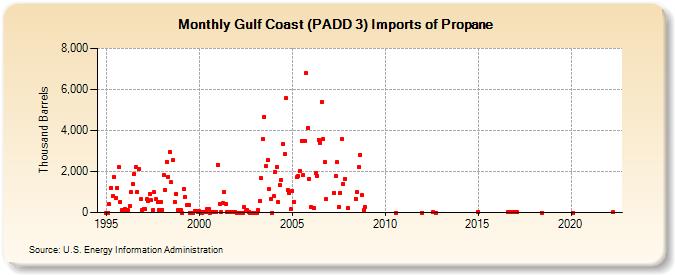
| Gulf Coast (PADD 3) Imports of Propane (Thousand Barrels) | ||||||||
| Year | Jan | Feb | Mar | Apr | May | Jun | Jul | Aug | Sep | Oct | Nov | Dec |
|---|---|---|---|---|---|---|---|---|---|---|---|---|
| 1995 | 0 | 0 | 402 | 1,198 | 801 | 1,722 | 724 | 1,217 | 2,226 | 538 | 105 | 109 |
| 1996 | 184 | 102 | 109 | 312 | 985 | 1,375 | 1,896 | 2,213 | 1,007 | 2,139 | 644 | 109 |
| 1997 | 151 | 165 | 639 | 544 | 905 | 590 | 134 | 986 | 637 | 510 | 105 | 514 |
| 1998 | 136 | 1,838 | 1,109 | 2,479 | 1,749 | 2,962 | 1,472 | 2,551 | 523 | 923 | 105 | 109 |
| 1999 | 109 | 0 | 1,152 | 751 | 377 | 369 | 0 | 0 | 0 | 80 | 55 | 50 |
| 2000 | 71 | 50 | 0 | 20 | 30 | 171 | 170 | 0 | 30 | 30 | 30 | 30 |
| 2001 | 2,341 | 430 | 30 | 459 | 1,026 | 427 | 30 | 30 | 30 | 30 | 30 | 30 |
| 2002 | 0 | 0 | 0 | 0 | 0 | 264 | 78 | 111 | 45 | 0 | 0 | 0 |
| 2003 | 0 | 0 | 107 | 582 | 1,667 | 3,565 | 4,678 | 2,258 | 2,560 | 1,131 | 663 | 0 |
| 2004 | 787 | 1,988 | 2,243 | 505 | 1,363 | 1,578 | 3,357 | 2,845 | 5,583 | 1,110 | 949 | 158 |
| 2005 | 1,051 | 532 | 1,715 | 1,777 | 2,036 | 3,510 | 1,826 | 3,508 | 6,784 | 4,125 | 1,655 | |
| 2006 | 275 | 199 | 1,905 | 1,789 | 3,542 | 3,414 | 5,411 | 3,588 | 2,446 | 638 | ||
| 2007 | 969 | 1,785 | 2,442 | 281 | 975 | 3,605 | 1,415 | 1,637 | ||||
| 2008 | 204 | 683 | 983 | 2,235 | 2,819 | 851 | 103 | 276 | ||||
| 2010 | 1 | |||||||||||
| 2012 | 1 | 11 | 1 | |||||||||
| 2014 | 2 | |||||||||||
| 2015 | 47 | |||||||||||
| 2016 | 8 | 11 | 3 | 5 | 8 | |||||||
| 2017 | 10 | 4 | ||||||||||
| 2018 | 1 | |||||||||||
| 2020 | 0 | |||||||||||
| 2022 | 16 | |||||||||||
| - = No Data Reported; -- = Not Applicable; NA = Not Available; W = Withheld to avoid disclosure of individual company data. |
| Release Date: 3/29/2024 |
| Next Release Date: 4/30/2024 |