|
Download Data (XLS File) |
|
||||||||
|
||||||||
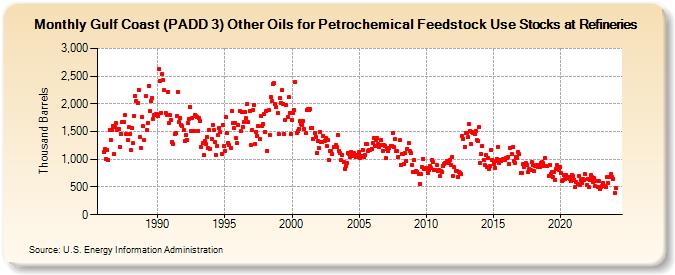
| Gulf Coast (PADD 3) Other Oils for Petrochemical Feedstock Use Stocks at Refineries (Thousand Barrels) | ||||||||
| Year | Jan | Feb | Mar | Apr | May | Jun | Jul | Aug | Sep | Oct | Nov | Dec |
|---|---|---|---|---|---|---|---|---|---|---|---|---|
| 1986 | 1,125 | 1,186 | 1,003 | 1,159 | 985 | 1,532 | 1,345 | 1,533 | 1,608 | 1,100 | 1,580 | 1,646 |
| 1987 | 1,525 | 1,553 | 1,223 | 1,463 | 1,664 | 1,674 | 1,664 | 1,795 | 1,456 | 1,343 | 1,576 | 1,454 |
| 1988 | 1,161 | 1,565 | 1,285 | 1,785 | 2,139 | 2,047 | 2,019 | 2,256 | 1,403 | 1,212 | 1,760 | 1,593 |
| 1989 | 1,342 | 2,141 | 1,531 | 1,656 | 2,318 | 1,864 | 2,055 | 2,109 | 1,718 | 1,790 | 1,811 | 1,816 |
| 1990 | 1,788 | 2,627 | 2,417 | 1,843 | 2,538 | 2,431 | 2,248 | 1,843 | 1,799 | 2,218 | 1,648 | 1,791 |
| 1991 | 1,710 | 1,312 | 1,277 | 1,450 | 1,472 | 1,785 | 2,215 | 1,665 | 1,742 | 1,619 | 1,598 | 1,537 |
| 1992 | 1,328 | 1,438 | 1,349 | 1,653 | 1,732 | 1,944 | 1,513 | 1,746 | 1,510 | 1,801 | 1,783 | 1,769 |
| 1993 | 1,510 | 1,746 | 1,685 | 1,214 | 1,286 | 1,076 | 1,332 | 1,284 | 1,399 | 1,197 | 1,527 | 1,193 |
| 1994 | 1,372 | 1,620 | 1,521 | 1,313 | 1,076 | 1,244 | 1,445 | 1,566 | 1,491 | 1,103 | 1,627 | 1,233 |
| 1995 | 1,158 | 1,755 | 1,475 | 1,298 | 1,249 | 1,200 | 1,873 | 1,650 | 1,563 | 1,653 | 1,376 | 1,293 |
| 1996 | 1,619 | 1,869 | 1,502 | 1,855 | 1,591 | 1,673 | 1,849 | 1,737 | 2,001 | 1,666 | 1,872 | 1,257 |
| 1997 | 1,535 | 1,885 | 1,987 | 1,283 | 1,492 | 1,421 | 1,593 | 1,373 | 1,785 | 1,609 | 1,628 | 1,818 |
| 1998 | 1,500 | 1,875 | 1,152 | 1,890 | 1,432 | 2,127 | 2,050 | 2,357 | 2,368 | 1,995 | 1,938 | 1,839 |
| 1999 | 1,458 | 2,102 | 2,018 | 2,248 | 2,002 | 1,448 | 1,712 | 1,981 | 1,770 | 2,116 | 1,842 | 1,447 |
| 2000 | 1,706 | 1,843 | 1,883 | 2,397 | 1,471 | 1,507 | 1,551 | 1,682 | 1,639 | 1,623 | 1,685 | 1,542 |
| 2001 | 1,468 | 1,884 | 1,902 | 1,885 | 1,908 | 1,571 | 1,562 | 1,372 | 1,473 | 1,407 | 1,115 | 1,326 |
| 2002 | 1,198 | 1,500 | 1,304 | 1,319 | 1,424 | 1,337 | 1,387 | 1,242 | 1,339 | 981 | 1,147 | 1,150 |
| 2003 | 1,093 | 1,228 | 1,228 | 1,262 | 1,221 | 1,438 | 1,149 | 1,107 | 978 | 1,077 | 957 | 826 |
| 2004 | 883 | 932 | 1,117 | 1,091 | 1,043 | 1,140 | 1,064 | 1,113 | 1,058 | 1,034 | 1,083 | 1,053 |
| 2005 | 1,135 | 1,024 | 1,065 | 1,172 | 1,041 | 1,076 | 1,275 | 1,268 | 1,155 | 1,164 | 1,171 | 1,191 |
| 2006 | 1,293 | 1,384 | 1,237 | 1,348 | 1,379 | 1,279 | 1,229 | 1,341 | 1,260 | 1,156 | 1,260 | 1,241 |
| 2007 | 1,015 | 1,181 | 1,157 | 1,205 | 1,242 | 1,248 | 1,470 | 1,216 | 1,362 | 1,142 | 1,149 | 1,049 |
| 2008 | 1,342 | 902 | 1,089 | 1,104 | 908 | 1,116 | 977 | 1,194 | 1,296 | 1,144 | 1,110 | 897 |
| 2009 | 772 | 984 | 762 | 789 | 778 | 733 | 561 | 742 | 857 | 1,013 | 816 | 832 |
| 2010 | 842 | 761 | 808 | 884 | 844 | 978 | 950 | 806 | 815 | 895 | 781 | 801 |
| 2011 | 690 | 783 | 779 | 878 | 912 | 936 | 975 | 940 | 938 | 990 | 889 | 1,046 |
| 2012 | 700 | 855 | 797 | 795 | 684 | 779 | 753 | 732 | 1,417 | 1,374 | 1,223 | 1,477 |
| 2013 | 1,474 | 1,397 | 1,636 | 1,513 | 1,273 | 1,490 | 1,466 | 1,449 | 1,515 | 1,347 | 1,327 | 1,588 |
| 2014 | 929 | 1,097 | 1,244 | 993 | 897 | 1,078 | 855 | 1,024 | 824 | 871 | 1,170 | 992 |
| 2015 | 915 | 838 | 975 | 1,004 | 1,228 | 933 | 992 | 976 | 996 | 999 | 984 | 1,021 |
| 2016 | 1,022 | 1,049 | 912 | 1,200 | 1,090 | 1,220 | 969 | 936 | 1,039 | 1,031 | 1,133 | 1,087 |
| 2017 | 758 | 757 | 907 | 863 | 905 | 931 | 905 | 772 | 829 | 800 | 946 | 898 |
| 2018 | 785 | 880 | 885 | 897 | 855 | 867 | 925 | 942 | 930 | 884 | 1,030 | 872 |
| 2019 | 872 | 705 | 897 | 733 | 766 | 675 | 771 | 627 | 824 | 892 | 809 | 859 |
| 2020 | 747 | 613 | 628 | 711 | 636 | 723 | 671 | 679 | 652 | 602 | 718 | 690 |
| 2021 | 635 | 504 | 597 | 562 | 707 | 533 | 627 | 577 | 648 | 631 | 734 | 538 |
| 2022 | 652 | 498 | 618 | 718 | 673 | 595 | 664 | 510 | 603 | 506 | 617 | 470 |
| 2023 | 504 | 523 | 574 | 518 | 497 | 672 | 577 | 687 | 689 | 733 | 682 | 642 |
| 2024 | 390 | |||||||||||
| - = No Data Reported; -- = Not Applicable; NA = Not Available; W = Withheld to avoid disclosure of individual company data. |
| Release Date: 3/29/2024 |
| Next Release Date: 4/30/2024 |