|
Download Data (XLS File) |
|
||||||||
|
||||||||
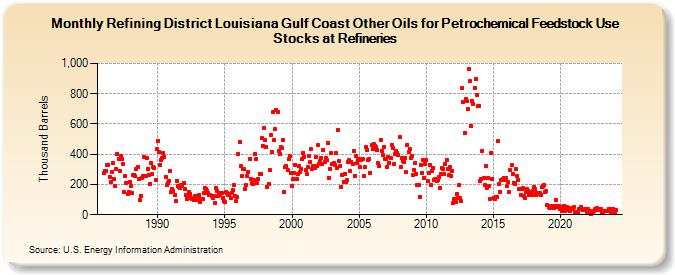
| Refining District Louisiana Gulf Coast Other Oils for Petrochemical Feedstock Use Stocks at Refineries (Thousand Barrels) | ||||||||
| Year | Jan | Feb | Mar | Apr | May | Jun | Jul | Aug | Sep | Oct | Nov | Dec |
|---|---|---|---|---|---|---|---|---|---|---|---|---|
| 1986 | 274 | 290 | 291 | 331 | 329 | 248 | 215 | 284 | 343 | 238 | 187 | 300 |
| 1987 | 401 | 368 | 289 | 385 | 370 | 334 | 152 | 257 | 213 | 135 | 152 | 214 |
| 1988 | 191 | 144 | 260 | 265 | 254 | 301 | 317 | 233 | 95 | 126 | 246 | 257 |
| 1989 | 381 | 253 | 373 | 304 | 264 | 206 | 339 | 268 | 317 | 312 | 228 | 432 |
| 1990 | 490 | 415 | 331 | 365 | 372 | 409 | 383 | 252 | 196 | 207 | 224 | 288 |
| 1991 | 147 | 170 | 157 | 128 | 89 | 225 | 189 | 180 | 177 | 197 | 189 | 211 |
| 1992 | 172 | 129 | 103 | 128 | 150 | 140 | 110 | 102 | 97 | 121 | 114 | 100 |
| 1993 | 125 | 132 | 84 | 105 | 106 | 144 | 176 | 170 | 159 | 143 | 129 | 128 |
| 1994 | 121 | 111 | 121 | 80 | 179 | 158 | 121 | 146 | 128 | 143 | 112 | 88 |
| 1995 | 82 | 147 | 145 | 129 | 134 | 109 | 145 | 162 | 196 | 124 | 89 | 117 |
| 1996 | 400 | 482 | 320 | 254 | 301 | 302 | 167 | 195 | 253 | 285 | 369 | 237 |
| 1997 | 212 | 201 | 227 | 399 | 370 | 211 | 237 | 270 | 266 | 505 | 456 | 574 |
| 1998 | 495 | 447 | 183 | 203 | 294 | 524 | 415 | 679 | 495 | 568 | 693 | 682 |
| 1999 | 420 | 404 | 450 | 438 | 493 | 149 | 313 | 325 | 294 | 367 | 387 | 273 |
| 2000 | 193 | 238 | 274 | 329 | 234 | 270 | 319 | 281 | 303 | 369 | 411 | 382 |
| 2001 | 295 | 266 | 315 | 386 | 350 | 433 | 303 | 323 | 310 | 381 | 320 | 459 |
| 2002 | 335 | 356 | 377 | 336 | 430 | 348 | 375 | 364 | 474 | 246 | 302 | 405 |
| 2003 | 337 | 339 | 331 | 406 | 310 | 559 | 353 | 321 | 184 | 265 | 218 | 270 |
| 2004 | 219 | 228 | 350 | 359 | 286 | 350 | 336 | 421 | 259 | 385 | 342 | 364 |
| 2005 | 366 | 315 | 365 | 369 | 254 | 315 | 447 | 428 | 362 | 371 | 279 | 458 |
| 2006 | 433 | 470 | 456 | 447 | 427 | 340 | 319 | 493 | 424 | 397 | 450 | 369 |
| 2007 | 366 | 318 | 384 | 345 | 373 | 464 | 438 | 337 | 400 | 419 | 407 | 393 |
| 2008 | 512 | 317 | 378 | 354 | 351 | 375 | 282 | 463 | 417 | 433 | 373 | 389 |
| 2009 | 262 | 298 | 345 | 272 | 197 | 198 | 120 | 328 | 278 | 363 | 245 | 334 |
| 2010 | 361 | 220 | 279 | 327 | 198 | 291 | 310 | 230 | 239 | 221 | 228 | 247 |
| 2011 | 174 | 270 | 307 | 303 | 269 | 336 | 364 | 305 | 264 | 316 | 255 | 286 |
| 2012 | 76 | 105 | 86 | 136 | 109 | 196 | 111 | 88 | 840 | 746 | 541 | 764 |
| 2013 | 752 | 700 | 963 | 881 | 589 | 754 | 733 | 841 | 900 | 793 | 718 | 720 |
| 2014 | 225 | 234 | 422 | 244 | 196 | 321 | 179 | 242 | 189 | 105 | 409 | 238 |
| 2015 | 113 | 103 | 116 | 114 | 485 | 201 | 153 | 230 | 235 | 240 | 230 | 241 |
| 2016 | 188 | 217 | 152 | 293 | 326 | 268 | 212 | 202 | 299 | 253 | 231 | 171 |
| 2017 | 131 | 168 | 177 | 126 | 111 | 153 | 170 | 160 | 132 | 148 | 131 | 160 |
| 2018 | 185 | 168 | 131 | 144 | 136 | 142 | 133 | 184 | 188 | 196 | 151 | 155 |
| 2019 | 61 | 48 | 47 | 59 | 57 | 55 | 47 | 57 | 96 | 54 | 55 | 40 |
| 2020 | 53 | 26 | 54 | 60 | 26 | 30 | 51 | 42 | 23 | 37 | 38 | 47 |
| 2021 | 49 | 19 | 12 | 19 | 38 | 40 | 54 | 39 | 31 | 33 | 40 | 21 |
| 2022 | 36 | 24 | 25 | 8 | 14 | 17 | 25 | 37 | 43 | 28 | 31 | 38 |
| 2023 | 36 | 11 | 21 | 24 | 24 | 22 | 24 | 40 | 37 | 14 | 39 | 41 |
| 2024 | 21 | |||||||||||
| - = No Data Reported; -- = Not Applicable; NA = Not Available; W = Withheld to avoid disclosure of individual company data. |
| Release Date: 3/29/2024 |
| Next Release Date: 4/30/2024 |