|
Download Data (XLS File) |
|
||||||||
|
||||||||
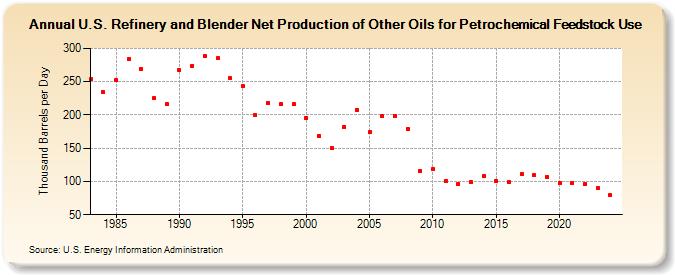
| U.S. Refinery and Blender Net Production of Other Oils for Petrochemical Feedstock Use (Thousand Barrels per Day) | ||||||||
| Decade | Year-0 | Year-1 | Year-2 | Year-3 | Year-4 | Year-5 | Year-6 | Year-7 | Year-8 | Year-9 |
|---|---|---|---|---|---|---|---|---|---|---|
| 1980's | 254 | 234 | 252 | 284 | 269 | 225 | 216 | |||
| 1990's | 267 | 274 | 288 | 285 | 255 | 243 | 200 | 218 | 216 | 216 |
| 2000's | 196 | 169 | 150 | 182 | 208 | 174 | 198 | 199 | 179 | 116 |
| 2010's | 118 | 101 | 96 | 99 | 108 | 101 | 99 | 111 | 109 | 107 |
| 2020's | 98 | 98 | 96 | 89 |
| - = No Data Reported; -- = Not Applicable; NA = Not Available; W = Withheld to avoid disclosure of individual company data. |
| Release Date: 3/29/2024 |
| Next Release Date: 8/30/2024 |