|
Download Data (XLS File) |
|
||||||||
|
||||||||
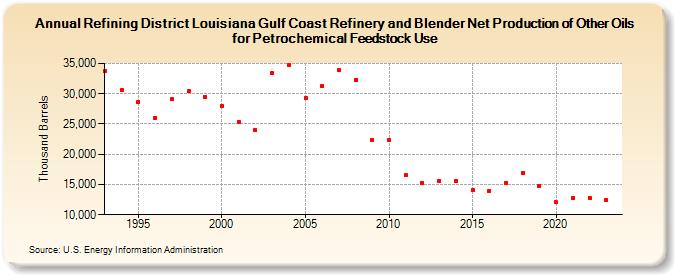
| Refining District Louisiana Gulf Coast Refinery and Blender Net Production of Other Oils for Petrochemical Feedstock Use (Thousand Barrels) | ||||||||
| Decade | Year-0 | Year-1 | Year-2 | Year-3 | Year-4 | Year-5 | Year-6 | Year-7 | Year-8 | Year-9 |
|---|---|---|---|---|---|---|---|---|---|---|
| 1990's | 33,776 | 30,641 | 28,640 | 26,054 | 29,053 | 30,384 | 29,439 | |||
| 2000's | 28,044 | 25,392 | 24,036 | 33,405 | 34,788 | 29,343 | 31,302 | 33,873 | 32,279 | 22,405 |
| 2010's | 22,299 | 16,522 | 15,211 | 15,547 | 15,631 | 14,006 | 13,962 | 15,244 | 16,973 | 14,817 |
| 2020's | 12,029 | 12,757 | 12,827 | 12,450 |
| - = No Data Reported; -- = Not Applicable; NA = Not Available; W = Withheld to avoid disclosure of individual company data. |
| Release Date: 3/29/2024 |
| Next Release Date: 8/30/2024 |