|
Download Data (XLS File) |
|
||||||||
|
||||||||
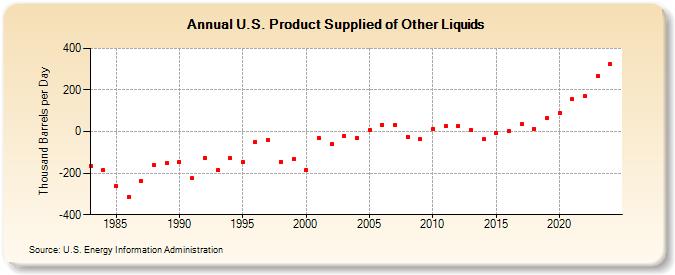
| U.S. Product Supplied of Other Liquids (Thousand Barrels per Day) | ||||||||
| Decade | Year-0 | Year-1 | Year-2 | Year-3 | Year-4 | Year-5 | Year-6 | Year-7 | Year-8 | Year-9 |
|---|---|---|---|---|---|---|---|---|---|---|
| 1980's | -166 | -186 | -262 | -314 | -238 | -161 | -151 | |||
| 1990's | -145 | -225 | -127 | -186 | -128 | -148 | -49 | -43 | -145 | -132 |
| 2000's | -186 | -32 | -60 | -20 | -30 | 6 | 33 | 32 | -25 | -37 |
| 2010's | 13 | 26 | 28 | 8 | -38 | -9 | 4 | 36 | 14 | 63 |
| 2020's | 89 | 156 | 169 | 267 |
| - = No Data Reported; -- = Not Applicable; NA = Not Available; W = Withheld to avoid disclosure of individual company data. |
| Release Date: 8/30/2024 |
| Next Release Date: 8/29/2025 |