|
Download Data (XLS File) |
|
||||||||
|
||||||||
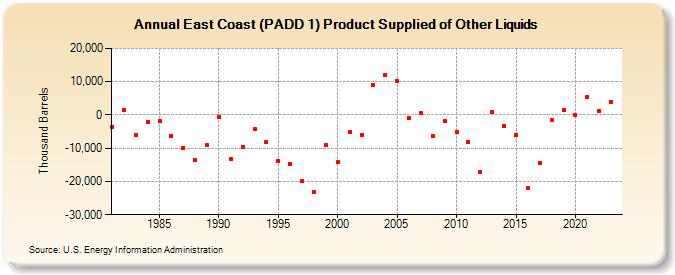
| East Coast (PADD 1) Product Supplied of Other Liquids (Thousand Barrels) | ||||||||
| Decade | Year-0 | Year-1 | Year-2 | Year-3 | Year-4 | Year-5 | Year-6 | Year-7 | Year-8 | Year-9 |
|---|---|---|---|---|---|---|---|---|---|---|
| 1980's | -3,581 | 1,498 | -6,113 | -2,179 | -1,818 | -6,408 | -9,939 | -13,634 | -9,012 | |
| 1990's | -723 | -13,261 | -9,716 | -4,327 | -8,006 | -13,821 | -14,701 | -19,942 | -23,284 | -9,138 |
| 2000's | -14,056 | -5,064 | -6,095 | 9,052 | 12,029 | 10,166 | -984 | 490 | -6,278 | -1,930 |
| 2010's | -5,129 | -8,088 | -17,086 | 861 | -3,481 | -6,099 | -22,094 | -14,521 | -1,611 | 1,531 |
| 2020's | -1 | 5,463 | 1,240 | 4,023 |
| - = No Data Reported; -- = Not Applicable; NA = Not Available; W = Withheld to avoid disclosure of individual company data. |
| Release Date: 3/29/2024 |
| Next Release Date: 8/30/2024 |