|
Download Data (XLS File) |
|
||||||||
|
||||||||
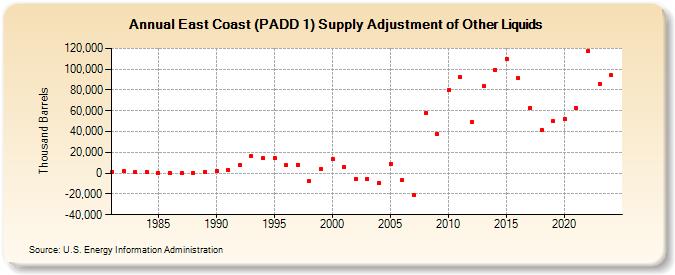
| East Coast (PADD 1) Supply Adjustment of Other Liquids (Thousand Barrels) | ||||||||
| Decade | Year-0 | Year-1 | Year-2 | Year-3 | Year-4 | Year-5 | Year-6 | Year-7 | Year-8 | Year-9 |
|---|---|---|---|---|---|---|---|---|---|---|
| 1980's | 1,292 | 1,665 | 1,011 | 780 | -55 | 103 | 116 | 392 | 1,570 | |
| 1990's | 2,080 | 3,247 | 7,678 | 16,903 | 14,317 | 14,679 | 7,489 | 8,196 | -7,822 | 4,268 |
| 2000's | 13,695 | 5,646 | -5,358 | -5,526 | -9,642 | 9,066 | -7,003 | -20,814 | 57,670 | 37,309 |
| 2010's | 79,661 | 92,474 | 49,622 | 83,431 | 99,400 | 109,607 | 91,729 | 62,552 | 41,966 | 49,903 |
| 2020's | 51,929 | 62,820 | 117,539 | 85,963 |
| - = No Data Reported; -- = Not Applicable; NA = Not Available; W = Withheld to avoid disclosure of individual company data. |
| Release Date: 3/29/2024 |
| Next Release Date: 8/30/2024 |