|
Download Data (XLS File) |
|
||||||||
|
||||||||
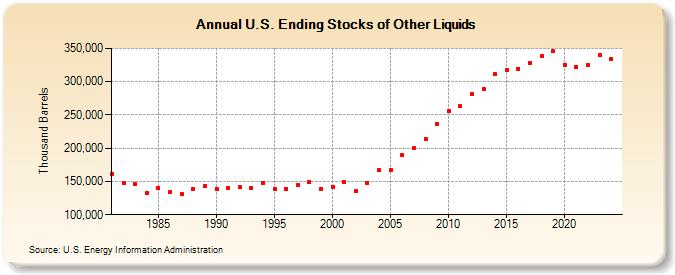
| U.S. Ending Stocks of Other Liquids (Thousand Barrels) | ||||||||
| Decade | Year-0 | Year-1 | Year-2 | Year-3 | Year-4 | Year-5 | Year-6 | Year-7 | Year-8 | Year-9 |
|---|---|---|---|---|---|---|---|---|---|---|
| 1980's | 161,779 | 147,005 | 145,551 | 132,194 | 139,789 | 133,484 | 131,240 | 139,107 | 143,419 | |
| 1990's | 139,302 | 139,830 | 140,941 | 140,577 | 147,800 | 139,248 | 139,241 | 144,817 | 149,082 | 139,348 |
| 2000's | 142,047 | 149,384 | 135,265 | 147,352 | 166,529 | 167,277 | 189,967 | 199,578 | 214,483 | 237,041 |
| 2010's | 256,175 | 262,725 | 281,299 | 288,671 | 310,831 | 316,885 | 319,545 | 328,230 | 338,104 | 345,667 |
| 2020's | 325,297 | 322,763 | 325,138 | 339,815 |
| - = No Data Reported; -- = Not Applicable; NA = Not Available; W = Withheld to avoid disclosure of individual company data. |
| Release Date: 8/30/2024 |
| Next Release Date: 8/29/2025 |