|
Download Data (XLS File) |
|
||||||||
|
||||||||
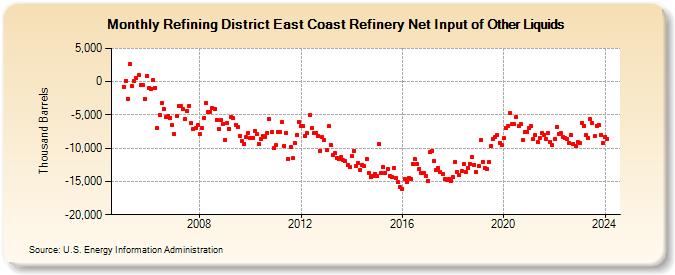
| Refining District East Coast Refinery Net Input of Other Liquids (Thousand Barrels) | ||||||||
| Year | Jan | Feb | Mar | Apr | May | Jun | Jul | Aug | Sep | Oct | Nov | Dec |
|---|---|---|---|---|---|---|---|---|---|---|---|---|
| 2005 | -760 | 142 | -2,562 | 2,616 | -660 | 158 | 564 | 936 | -455 | -468 | -2,565 | 816 |
| 2006 | -900 | -1,034 | 209 | -891 | -6,959 | -4,982 | -3,253 | -4,133 | -5,385 | -5,185 | -5,447 | -6,576 |
| 2007 | -7,871 | -5,108 | -3,676 | -3,730 | -4,121 | -5,656 | -4,387 | -3,608 | -6,210 | -7,096 | -7,015 | -6,575 |
| 2008 | -7,936 | -6,965 | -5,438 | -3,246 | -4,541 | -4,497 | -3,943 | -4,146 | -5,695 | -7,095 | -5,736 | -6,314 |
| 2009 | -8,767 | -6,228 | -7,067 | -5,257 | -5,483 | -6,460 | -6,818 | -8,096 | -8,993 | -9,300 | -8,368 | -7,700 |
| 2010 | -8,504 | -8,395 | -7,389 | -7,929 | -9,395 | -8,603 | -8,147 | -8,272 | -7,715 | -5,592 | -7,613 | -10,030 |
| 2011 | -9,586 | -7,622 | -7,550 | -6,051 | -9,605 | -7,706 | -11,564 | -9,893 | -11,532 | -9,276 | -8,030 | -6,048 |
| 2012 | -6,713 | -6,622 | -8,172 | -7,699 | -5,060 | -6,971 | -7,725 | -7,671 | -8,120 | -10,359 | -8,328 | -8,822 |
| 2013 | -10,333 | -6,718 | -9,534 | -11,095 | -10,763 | -11,473 | -11,574 | -11,388 | -11,819 | -11,939 | -12,533 | -12,873 |
| 2014 | -11,196 | -10,370 | -12,713 | -12,207 | -13,222 | -12,526 | -12,630 | -11,688 | -13,663 | -14,279 | -14,133 | -13,807 |
| 2015 | -14,205 | -9,404 | -13,698 | -12,809 | -13,686 | -13,152 | -14,153 | -14,352 | -12,913 | -14,439 | -15,131 | -15,909 |
| 2016 | -16,062 | -14,590 | -15,067 | -14,502 | -14,683 | -12,333 | -11,666 | -12,386 | -13,067 | -13,701 | -13,779 | -14,155 |
| 2017 | -14,862 | -10,631 | -10,411 | -11,879 | -13,308 | -13,008 | -13,654 | -13,894 | -14,662 | -14,788 | -14,629 | -14,900 |
| 2018 | -14,404 | -12,034 | -13,517 | -14,096 | -13,486 | -12,437 | -13,636 | -12,936 | -12,314 | -11,286 | -12,482 | -13,611 |
| 2019 | -12,752 | -8,832 | -12,014 | -13,018 | -13,172 | -12,029 | -9,723 | -8,584 | -8,312 | -8,022 | -9,183 | -9,499 |
| 2020 | -8,533 | -6,930 | -6,735 | -4,690 | -6,429 | -6,407 | -5,349 | -6,729 | -6,386 | -8,744 | -7,520 | -7,538 |
| 2021 | -7,027 | -6,684 | -8,683 | -8,044 | -9,108 | -8,486 | -7,722 | -7,968 | -8,593 | -7,698 | -9,047 | -9,523 |
| 2022 | -8,662 | -6,757 | -7,808 | -7,762 | -8,275 | -8,417 | -8,654 | -9,179 | -8,026 | -9,298 | -9,729 | -9,044 |
| 2023 | -9,224 | -6,184 | -6,676 | -8,055 | -8,441 | -5,683 | -6,168 | -8,185 | -6,637 | -6,443 | -7,965 | -9,151 |
| 2024 | -8,274 | |||||||||||
| - = No Data Reported; -- = Not Applicable; NA = Not Available; W = Withheld to avoid disclosure of individual company data. |
| Release Date: 3/29/2024 |
| Next Release Date: 4/30/2024 |
Referring Pages: