|
Download Data (XLS File) |
|
||||||||
|
||||||||
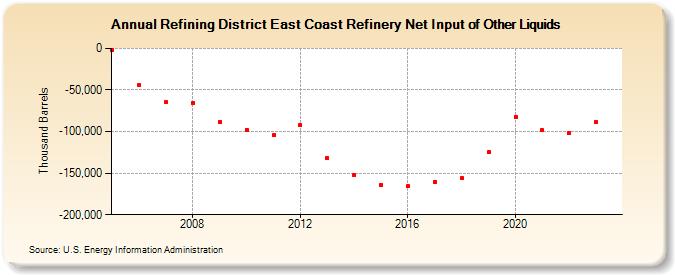
| Refining District East Coast Refinery Net Input of Other Liquids (Thousand Barrels) | ||||||||
| Decade | Year-0 | Year-1 | Year-2 | Year-3 | Year-4 | Year-5 | Year-6 | Year-7 | Year-8 | Year-9 |
|---|---|---|---|---|---|---|---|---|---|---|
| 2000's | -2,238 | -44,536 | -65,053 | -65,552 | -88,537 | |||||
| 2010's | -97,584 | -104,463 | -92,262 | -132,042 | -152,434 | -163,851 | -165,991 | -160,626 | -156,239 | -125,140 |
| 2020's | -81,990 | -98,583 | -101,611 | -88,812 |
| - = No Data Reported; -- = Not Applicable; NA = Not Available; W = Withheld to avoid disclosure of individual company data. |
| Release Date: 3/29/2024 |
| Next Release Date: 8/30/2024 |
Referring Pages: