|
Download Data (XLS File) |
|
||||||||
|
||||||||
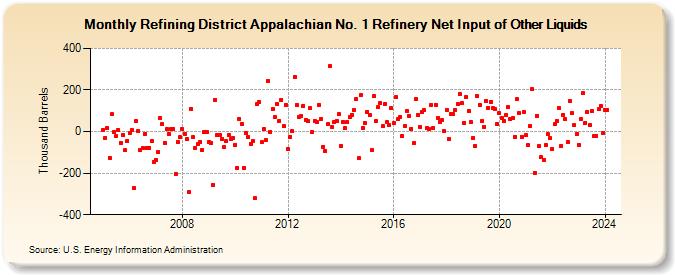
| Refining District Appalachian No. 1 Refinery Net Input of Other Liquids (Thousand Barrels) | ||||||||
| Year | Jan | Feb | Mar | Apr | May | Jun | Jul | Aug | Sep | Oct | Nov | Dec |
|---|---|---|---|---|---|---|---|---|---|---|---|---|
| 2005 | 8 | -31 | 16 | -125 | 83 | -2 | -22 | 8 | -53 | -17 | -91 | -44 |
| 2006 | -9 | 7 | -272 | 49 | 2 | -89 | -79 | -10 | -77 | -79 | -44 | -145 |
| 2007 | -136 | -97 | 66 | 36 | -53 | 13 | -10 | 14 | 10 | -202 | -52 | -28 |
| 2008 | 12 | -11 | -37 | -291 | 109 | -28 | -77 | -61 | -51 | -89 | -4 | -3 |
| 2009 | -52 | -56 | -255 | 152 | -17 | -17 | -34 | -76 | -46 | -18 | -35 | -31 |
| 2010 | -63 | -174 | 61 | 38 | -173 | -9 | -27 | -61 | -46 | -321 | 131 | 142 |
| 2011 | -52 | 12 | -42 | 245 | -1 | 108 | 69 | 132 | 51 | 153 | 25 | 129 |
| 2012 | -85 | -25 | 3 | 262 | 130 | 68 | 75 | 125 | 57 | 50 | 111 | -3 |
| 2013 | 51 | 46 | 129 | 62 | -72 | -92 | 34 | 313 | 22 | 44 | 53 | 83 |
| 2014 | -70 | 45 | 16 | 45 | 71 | 82 | 104 | 155 | -129 | 174 | 18 | 42 |
| 2015 | 96 | 81 | -90 | 170 | 49 | 116 | 137 | 26 | 134 | 44 | 30 | 112 |
| 2016 | 39 | 165 | 60 | 72 | -21 | 25 | 100 | 76 | 14 | -55 | 155 | 82 |
| 2017 | 22 | 92 | 103 | 19 | 11 | 129 | 15 | 130 | 67 | 46 | 55 | 1 |
| 2018 | 104 | -36 | 83 | 85 | 104 | 132 | 180 | 136 | 42 | 166 | 101 | 45 |
| 2019 | -30 | -70 | 170 | 128 | 50 | 24 | 147 | 114 | 142 | 114 | 109 | 35 |
| 2020 | 87 | 65 | 53 | 79 | 118 | 61 | 65 | -25 | 155 | 90 | -25 | 95 |
| 2021 | -18 | -66 | 29 | 203 | -197 | 77 | -71 | -124 | -138 | -65 | -14 | -33 |
| 2022 | -84 | 36 | 51 | 112 | -69 | 81 | 60 | -51 | 146 | 89 | 30 | -14 |
| 2023 | -63 | 58 | 184 | 43 | 93 | 31 | 99 | -21 | -19 | 107 | 125 | -8 |
| 2024 | 105 | |||||||||||
| - = No Data Reported; -- = Not Applicable; NA = Not Available; W = Withheld to avoid disclosure of individual company data. |
| Release Date: 3/29/2024 |
| Next Release Date: 4/30/2024 |
Referring Pages: