|
Download Data (XLS File) |
|
||||||||
|
||||||||
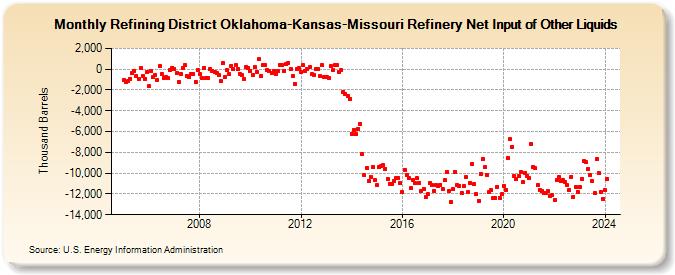
| Refining District Oklahoma-Kansas-Missouri Refinery Net Input of Other Liquids (Thousand Barrels) | ||||||||
| Year | Jan | Feb | Mar | Apr | May | Jun | Jul | Aug | Sep | Oct | Nov | Dec |
|---|---|---|---|---|---|---|---|---|---|---|---|---|
| 2005 | -1,049 | -1,221 | -1,170 | -917 | -398 | -149 | -624 | -919 | 141 | -622 | -899 | -305 |
| 2006 | -1,621 | -209 | -784 | -581 | -995 | 279 | -429 | -803 | -754 | -850 | -55 | 149 |
| 2007 | -26 | -401 | -1,214 | -424 | 153 | 387 | -671 | -734 | -482 | -461 | -1,229 | -97 |
| 2008 | -474 | -815 | 154 | -868 | -835 | -1 | -132 | -261 | -342 | -604 | -1,142 | 589 |
| 2009 | -722 | -65 | -468 | 352 | 47 | 374 | 5 | -433 | -576 | -982 | 240 | 90 |
| 2010 | -192 | -574 | 179 | -250 | 934 | -673 | 431 | 400 | -73 | -194 | -398 | -170 |
| 2011 | -419 | -209 | 444 | 420 | -144 | 525 | 597 | 15 | -610 | -1,404 | -21 | 77 |
| 2012 | -240 | 387 | -156 | 35 | 228 | -465 | -559 | 20 | -2 | -670 | 355 | -721 |
| 2013 | -761 | -836 | 283 | -91 | 391 | 365 | -307 | -66 | -2,199 | -2,365 | -2,544 | -2,864 |
| 2014 | -6,210 | -5,820 | -6,279 | -5,710 | -5,232 | -8,205 | -10,200 | -9,468 | -10,758 | -10,350 | -9,453 | -10,686 |
| 2015 | -11,172 | -9,457 | -9,301 | -9,265 | -9,582 | -10,552 | -11,003 | -11,017 | -10,774 | -10,475 | -10,468 | -10,949 |
| 2016 | -11,818 | -9,671 | -10,141 | -10,510 | -11,475 | -10,694 | -10,975 | -10,508 | -10,930 | -11,700 | -11,543 | -12,328 |
| 2017 | -11,988 | -10,958 | -11,178 | -11,725 | -11,144 | -11,214 | -11,115 | -11,520 | -10,661 | -9,850 | -11,710 | -12,772 |
| 2018 | -11,543 | -9,864 | -11,160 | -11,195 | -11,901 | -11,238 | -10,417 | -11,846 | -10,957 | -9,127 | -11,061 | -12,024 |
| 2019 | -12,642 | -10,053 | -8,651 | -9,457 | -10,174 | -11,821 | -11,623 | -12,388 | -12,413 | -11,303 | -12,346 | -12,032 |
| 2020 | -11,226 | -11,595 | -8,512 | -6,727 | -7,480 | -10,281 | -10,575 | -10,273 | -9,901 | -10,872 | -10,019 | -10,248 |
| 2021 | -10,499 | -7,186 | -9,386 | -9,547 | -11,183 | -11,593 | -11,710 | -11,871 | -11,880 | -11,749 | -12,161 | -12,142 |
| 2022 | -12,584 | -10,680 | -10,402 | -10,764 | -10,665 | -10,895 | -11,187 | -11,608 | -10,338 | -12,248 | -11,315 | -11,802 |
| 2023 | -11,313 | -10,522 | -8,859 | -8,962 | -9,592 | -10,147 | -10,785 | -11,931 | -8,647 | -9,972 | -11,812 | -12,496 |
| 2024 | -11,626 | |||||||||||
| - = No Data Reported; -- = Not Applicable; NA = Not Available; W = Withheld to avoid disclosure of individual company data. |
| Release Date: 3/29/2024 |
| Next Release Date: 4/30/2024 |